
Introduction
Multicolor confocal microscopy is a fundamental technique in cell biology labs today. To unravel the complexity inherent in biological systems, you need to be able to analyze multiple structures, molecules and microenvironments in your sample at the same time, in context with each other. In microscopy, this can be achieved by labeling each feature of interest with a differently colored fluorescent marker or biosensor, and then performing simultaneous or sequential multichannel imaging to capture the signal from each probe in a dedicated channel. But there are limits to the number of fluorophores you can successfully distinguish with this “multiplexing” approach. Let’s take a closer look at some challenges that limit multiplexing capacity in multicolor confocal microscopy, and some strategies you can take to improve the separation of fluorophores and increase the number of fluorescent probes you can distinguish in your sample.
Why are multicolor confocal experiments so challenging?
The inability to find the right combinations of fluorescent probes for multicolor confocal microscopy is a common frustration that can significantly delay progress in the lab. Factors that contribute to this problem include the availability of spectrally separable fluorescent dyes or fluorescent proteins (FP) in combination with confocal system constraints such as the number and specificity of available excitation lines, filters and detectors on your system. While excitation and emission peaks of organic fluorophores typically have widths of about 35 nm at half their maximum height (FWHM), the full spectral profile can often span several hundred nanometers including shoulders and long trailing tails (see Fig 1). Given that the visible spectrum itself spans only about 360 nm (from ~380-740 nm), some degree of significant overlap is almost inevitable in multicolor experiments, especially those combining more than 3 fluorophores. Spectral overlap, as we shall see, can lead to serious artifacts, including unwanted energy transfer between fluorophores and bleed-through (also called spectral crosstalk or crossover) of emission from one fluorophore into the detection channel reserved for another. On top of that, you may encounter additional experimental constraints, such as autofluorescence and phototoxicity issues that preclude the use of dyes excited in certain areas of the spectrum.
Consider a 4-color experiment where the preferred dyes are Alexa 488, Alexa 546, Alexa 568 and TOTO-3 (Fig 1). Excitation lines must be carefully positioned to avoid exciting more than the intended dyes in each channel. This may come with trade-offs such as inefficient excitation of some species due to off-peak centering. More significantly, the strong spectral overlap of emission curves makes it a challenge to avoid bleed-through artifacts. As a consequence, it becomes difficult to tell which fluorophore actually produced the signal you see in the affected image channel.

The consequences of bleed-through
To illustrate how bleed-through can impact your experimental results, Figure 2 (A) shows typical excitation profiles for just two fluorophores, one green and one red. As can be seen in panel B, the corresponding emission profiles for the two dyes overlap. If the emission levels of two dyes are not comparable within the sample, the relative proportion of overlap can be even more significant (C). When the emitted light is passed to the detector (through band pass filters in this hypothetical case), the signal from both fluorophores is detected in the red channel (D).
Bleed-through artifacts like this can lead to serious errors in data interpretation, particularly if subcellular co-localization of fluorophores is under investigation or quantitative measurements are necessary. For instance, when the green and red channel images from the previous example are overlaid, it will appear as if the two dyes are partially co-localized, when in reality they are partitioned into separate subcellular compartments (Fig 3). Bleed-through can also compromise experiments that rely on intensity measurements, such as those involving Förster resonance energy transfer (FRET) or fluorescence recovery after photobleaching (FRAP).

Considerations for specimen labeling
When preparing samples for multicolor confocal experiments, there are a number of important considerations and actions you can take to avoid or reduce artifacts caused by spectral overlap.
Fluorophore selection
Consider whether it is possible to substitute potentially problematic fluorophores with dyes that have more narrow emission peaks and/or larger Stokes shifts (separation between excitation and emission maxima). For example, fluorescent quantum dots (QDs) have a number of properties that make them amenable to multiplexing, including relatively narrow and symmetric emission curves, a wide choice of colors well-distributed across the spectrum, and the ability to excite multiple spectral variants simultaneously with the same excitation wavelength. Some genetically encoded FPs have also been engineered for improved multiplexing, such as Keima and LSSmOrange, which have exceptionally large Stokes shifts, enabling single-excitation multicolor imaging in combination with conventional FPs and chemical dyes.
Balance of emission intensities
If there are significant differences in the emission intensity levels of fluorophores in your sample, the signal from strongly fluorescing species can overwhelm that from weaker species, and lead to a disproportionate amount of bleed-through relative to true signal in a particular channel (see Fig 2). Target abundance, dye concentration, quantum yield, photo-stability, and illumination intensity are all factors that can contribute to emission imbalances. If the abundance of different targets in your sample varies widely, it is prudent to reserve the brightest and most photostable dyes for the least-abundant targets. The concentrations of fluorescent probes should be carefully titrated during sample preparation. In some cases, this may not be possible-for example, when imaging live cells expressing differentially regulated FP species. In such instances, you may be able to compensate for the misbalance at the image acquisition stage by optimizing the excitation intensity in each channel using positive and negative control samples.
Preparation of control samples
Single-stained control samples are crucial for assessing and reducing bleed-through when optimizing image acquisition parameters. They also provide information that can be used downstream for spectral unmixing, as well as to support experimental conclusions (e.g. when publishing the results of co-localization studies or quantitative microscopy approaches). For live cell assays, it is very important to have replicate single-stained samples prepared with and without stimulation (i.e. positive and negative controls), so that you can assess the potential for bleed-through and other artifacts across the expected dynamic range of your assay and adjust the acquisition settings accordingly.


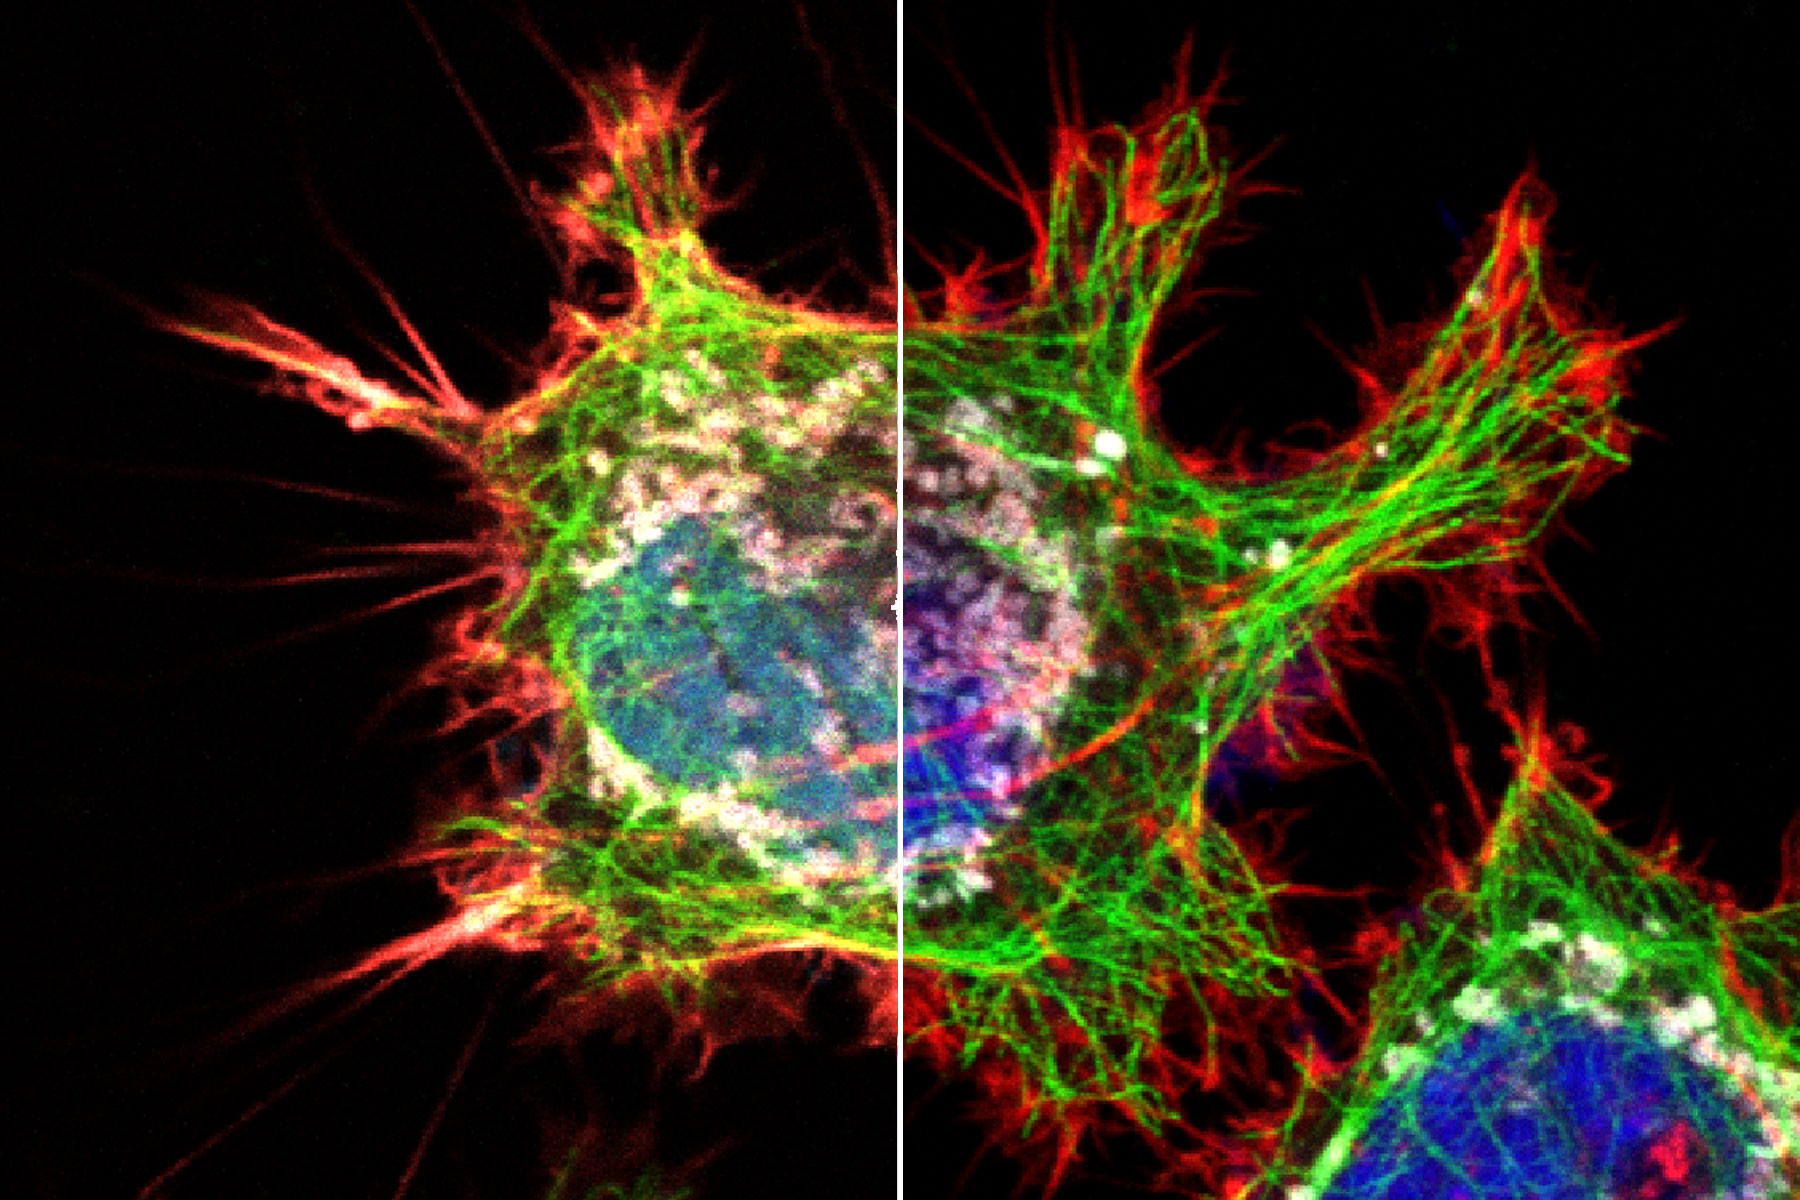
Figure 3: HeLa cells (fibroblasts); blue: Dapi, nucleus; green: Alexa 488, tubulin; red: TRITC phalloidin, actin; grey: Mito Tracker Red CMXRos, mitochondria.
Optimizing image acquisition to maximize spectral separation
Once sample preparation has been optimized, the next essential step is to optimize the acquisition parameters.
Instrument configuration and acquisition settings
Optimal setup of the optical light path including choice of lasers, excitation lines, filter combinations and detection bandwidths, is fundamental to minimizing spectral crosstalk, especially during simultaneous scanning. An iterative approach to both instrument setup and sample preparation may be required to find the ideal balance between minimizing artifacts and achieving a signal within the dynamic range necessary for reliable detection and quantification. This can be especially challenging in live cell experiments, where FP expression levels and dye concentrations can vary widely and unpredictably.
Sequential imaging
When performing simultaneous multi-channel imaging, artifacts may arise from crossover of excitation or emission spectra. In cases where the excitation spectra of two fluorophores are sufficiently separated, but their emission profiles overlap, you may be able to avoid bleed-through by sequential imaging with one excitation line at a time. Due to the tendency of excitation and emission profiles to mirror each other in their asymmetry, crossover of excitation spectra tends to occur toward the blue end of the spectrum (shorter wavelengths), where the peak tends to have a longer tail, while emission spectra are more likely to have extended overlapping tails toward the red end of the spectrum (longer
wavelengths). This means that shorter wavelength fluorophores are more likely to bleed into the longer wavelength channels, rather than the other way around. For this reason, the order in which you acquire the images can make a difference. Usually it is advisable to excite with the longest wavelength first, working sequentially down to the shortest. A downside to sequential scanning is that it may be too slow for some applications, such as monitoring rapid dynamic events in live cells. In addition, sequential imaging will not prevent bleed-through in cases where the two or more fluorophores are excited by the same laser line.
Spectral unmixing algorithms
Despite best efforts, it may be impossible to prevent or adequately reduce emission imbalances and spectral overlap arising during the preanalytical steps of your experiment. Fortunately, it may still be possible to spectrally resolve the fluorophores in your sample through analytical methods after image acquisition. To mathematically restore the signal from each fluorophore into its respective channel, unmixing algorithms are usually based on either linear unmixing or cluster analysis methods. The former relies on either user-estimated distributions or the use of reference spectra to calculate distribution coefficients for each component fluorophore. Cluster analysis methods provide a good
alternative to linear unmixing in cases where no spectral information is available. Instead of using reference spectra, the main distribution coefficients are determined by fitting.
While spectral unmixing tools are of great utility, their ability to resolve fluorescent probes in your sample has two main limitations. The first is that spectral unmixing is constrained by the number of detectors on your system. In other words, you can’t unmix more colors than your system can detect. The second main limitation is that spectral unmixing algorithms cannot differentiate between fluorophores of the same color - i.e. those that have similar emission spectra.
Beyond the spectral options with lifetime imaging
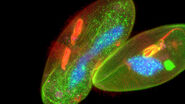
But what if there were a way to overcome spectral imaging limitations without the need to add another detector to your system or to source alternative fluorophores? The key is to look beyond the analysis of spectral information and add another dimension to the analysis: fluorescence lifetime. Fluorescence lifetime is a measure of the time a fluorophore spends in the excited state before emitting a photon. The lifetime information is orthogonal to the fluorescence intensity information and may be used to distinguish dyes with similar spectra, if they have different lifetimes (Fig 4). Recent advances in technology for lifetime analysis have made it possible to integrate lifetime detection capability into the confocal scan head, so that lifetime and spectral information can be collected simultaneously. The result is the ability to combine lifetime and spectral information to distinguish more fluorophores using the lifetime-based information.

, and tubulin immunolabeled with Alexa Fluor 546 (blue). The fluorophores are spectrally very similar, but they are separated using the fluorescence lifetime information.")
Fig. 4: Cytoskeleton structures distinguished by lifetime contrast.
Summary and conclusions
Good spectral separation of fluorophores in multicolor confocal microscopy is fundamental to achieving high quality results and being able to include more fluorescent probes in your experiment. Careful optimization of samples and instrument settings prior to imaging play a big part in reducing artifacts arising from unwanted spectral overlap. Where once there was little you could do to improve outcomes after image acquisition, with spectral unmixing approaches it is now possible to address bleed-through issues post-acquisition despite suboptimal imaging conditions. Most notably, pioneering advances in the implementation of lifetime imaging on a confocal platform have now enabled seamless integration of powerful fluorescence lifetime capability into confocal microscopy workflows, providing scientists with the ability to distinguish fluorophores that could not previously be distinguished with spectral unmixing.
Download the PDF
Related Articles
-

Extended Live-cell Imaging at Nanoscale Resolution
Extended live-cell imaging with TauSTED Xtend. Combined spatial and lifetime information allow…
Mar 05, 2024Read article -
 dataset, showing the biochemically distinct structures of a fresh, untreated apple slice.")
How to Prepare Samples for Stimulated Raman Scattering (SRS) imaging
Find here guidelines for how to prepare samples for stimulated Raman scattering (SRS), acquire…
Feb 05, 2024Read article -
Coherent Raman Scattering Microscopy Publication List
CRS (Coherent Raman Scattering) microscopy is an umbrella term for label-free methods that image…
Sep 11, 2023Read article
Related Pages
-

Confocal Microscopes
Our confocal microscopes for top-class biomedical research provide imaging precision for subcellular…
Visit related page -
Life Science Research
Leica Microsystems’ life science research microscopes support the imaging needs of the scientific…
Visit related page