
Introduction
This study assessed immune signatures across tissue microarrays collected from 100+ treated patients, which were then analyzed using a machine learning workflow. To test the quality of that workflow, the assessments made by the model were compared against scoring by a trained pathologist using Cell DIVE’s virtual hematoxylin and eosin staining feature. The cores were then imaged for the markers CD45, CD3, CD4, CD8 to detect immune cells, and analyzed by the model to score stromal and immune cell infiltration in the patient tumor cores. A very high degree of agreement was found between the pathologists scoring of stroma and immune cells (ranked low, medium, and high) showing that Cell DIVE generates high-quality, interpretable data using this machine learning workflow.
Method
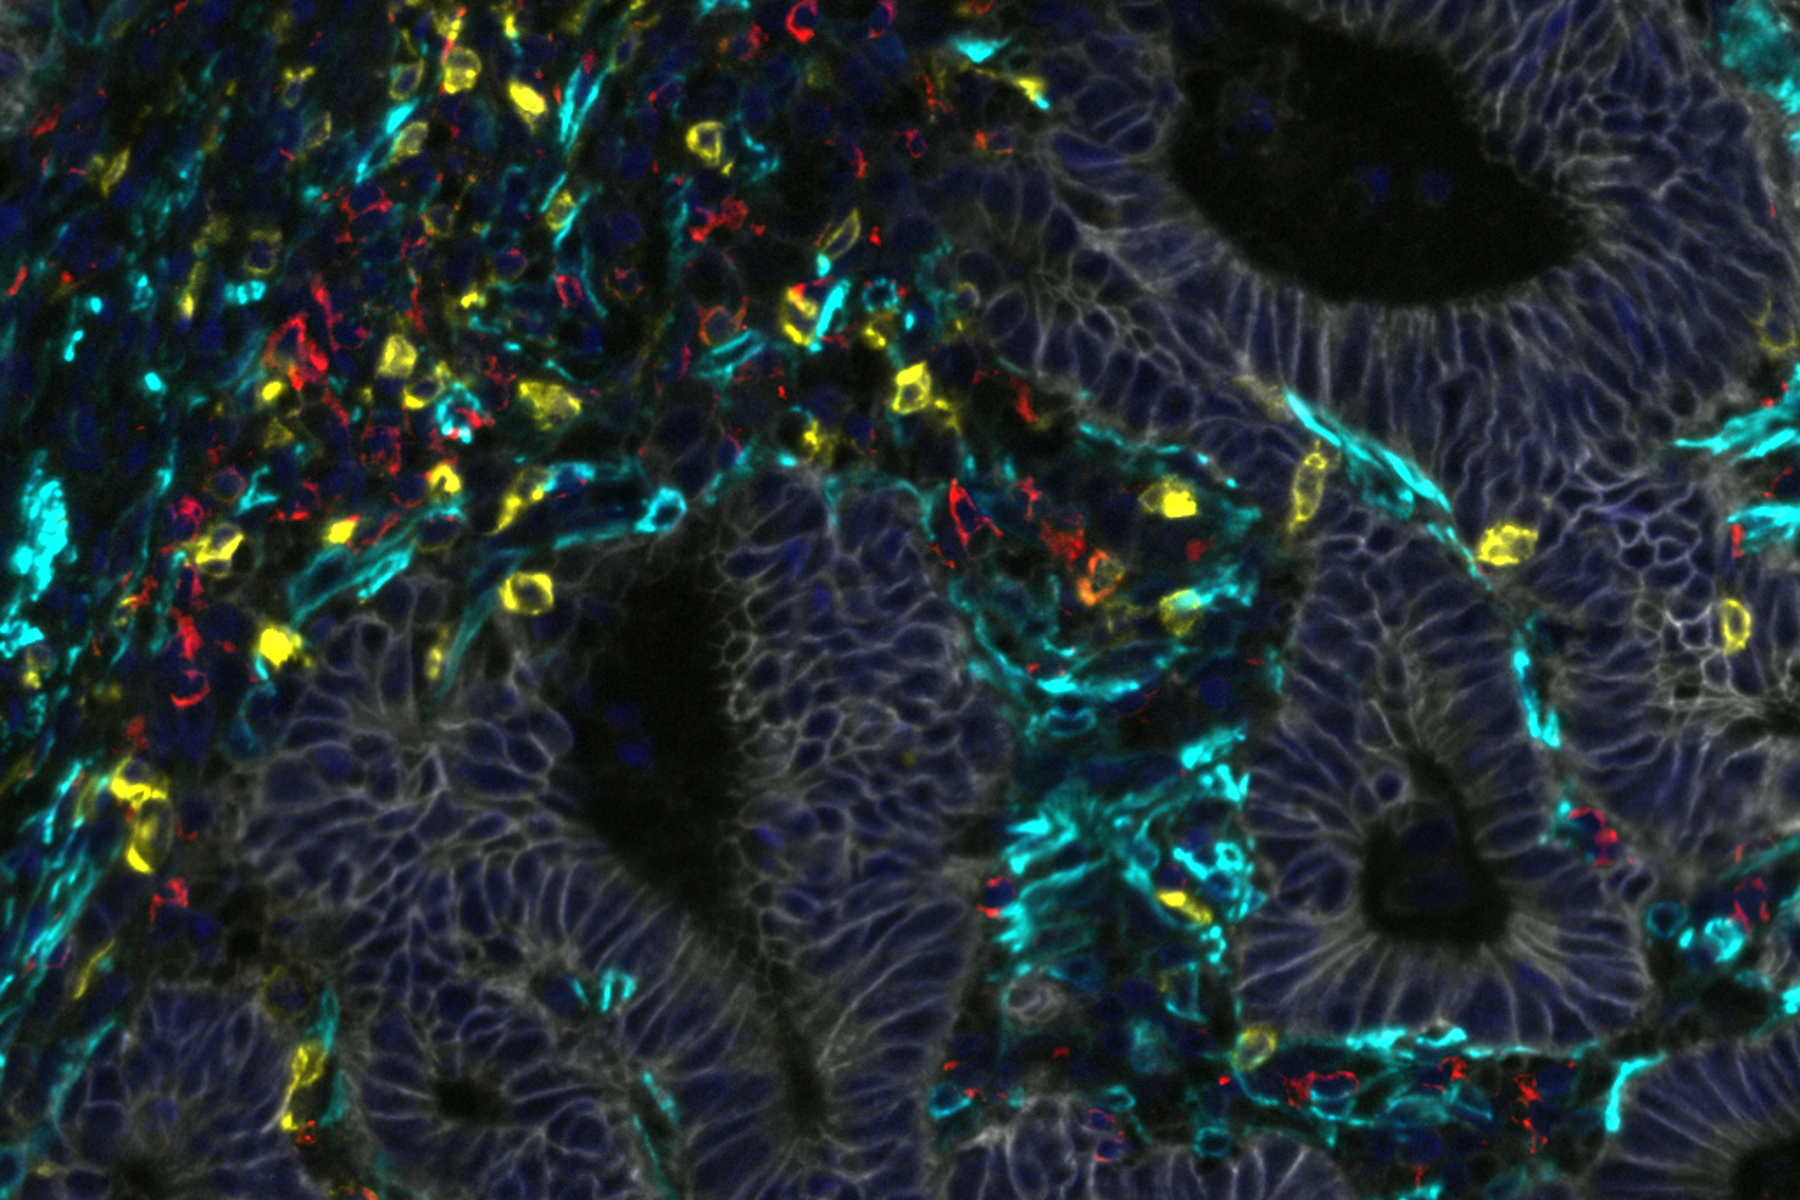
Next, the population of T cell subtypes in the cores was determined using multimarker analysis (with CD3, CD4, CD8, FOXP3, PD1 as markers). The populations, position, and spatial associations within and between T cell subtypes were analyzed, revealing the presence of Th, Tc, and Treg cells, with and without PD1. Using this information, the authors performed a statistical analysis to determine whether an increase in any of these subtypes was correlated with longer survival of the patients after treatment. One of these subtypes, PD1-negative Treg cells, was indeed correlated with increased survival. Furthermore, a preponderance of these Treg cells in immune hotspots within the cores was even more tightly correlated with disease-free survival.

Conclusion
In conclusion, Cell DIVE, alongside the machine learning analysis workflow developed by the authors, revealed the amount and positions of a variety of T cell types within colorectal cancer tumor cores. With this information, the authors showed that a specific subtype of these immune cells was a signal for survival of the patient. Importantly, the authors’ multimarker phenotypic analysis may have provided a more granular identification of these Treg cells, resolving some of the ambiguity over their role in survival. Thus, multiplexed imaging and analysis of tumor samples may provide a future means to target clinical resources towards those patients with higher risk profiles.
Abstract Link
Stachtea X., Loughry M.B.; Salvucci M., Lindner A.U., Cho S., McDonough E., Sood A., Graf J., Santamaria-Pang A., Corwin A., Laurent-Puig P., Dasgupta S., Shia J., Owens J.R., Abate S., Van Schaeybroeck S., Lawler M., Prehn J.H.M., Ginty F. & Longley D.B.:
Stratification of chemotherapy-treated stage III colorectal cancer patients using multiplexed imaging and single-cell analysis of T-cell populations
Modern Pathology volume 35, pages 564–576 (2022)