What is TauInteraction?
Molecular interactions fuel the cellular machinery, translating the genomic information into physical work (Jacob F, Monod J. 1961). Broadly speaking, there are at least three types of molecular interactions: nucleic acid (DNA/RNA)-protein, protein-protein, and small molecules – protein (Zhang W et al. 2002, Schlessinger K et al. 2009, Yan L and Lamb RF 2011, Dunn JA et al. 2015, Pires BRB et al. 2018, Vidya MK et al. 2018).
The tool of choice to experimentally confirm that an interaction between two molecules is occurring is through Förster Resonant Energy Transfer (FRET, Förster 1960). To perform a FRET experiment, one of the molecules under study is tagged with a fluorescent probe that acts as a “donor”, and the other one is tagged with a probe acting as the “acceptor”. This so-called “donor-acceptor pair” is selectively chosen so that the emission of the donor substantially overlaps with the absorption of the acceptor. Under these conditions, FRET can take place if the two fluorophores are sufficiently close to each other (less than 10 nm – Valeur 2001) and if they are favourably oriented (Pietraszewska-Bogiel and Gadella 2011). The distance and orientation will determine how much FRET is taking place; this is known as FRET efficiency and the most widespread way to quantify molecular interaction (Valeur 2001). The other value that reports on the occurrence of FRET is the fraction of interacting donor (fD) that corresponds to how many molecules are participating on the molecular interactions at a given time (Valeur 2001). In essence, the energy from the excited state of the donor fluorophore is transferred non-radiatively (without emitting a photon) through absorption to the acceptor fluorophore. This process results in 1) the decrease of the fluorescence intensity of the donor, 2) the increase of the fluorescence intensity of the acceptor, and 3) a decrease of the fluorescence lifetime for the donor (Jares-Erijman and Jovin 2006). These different readouts from donor and acceptor are the basis of a number of strategies for acquiring and analysing FRET data. Many FRET approaches rely on intensity based measurements such as quenching of donor, acceptor photobleaching, and sensitized emission (Berney and Danuser 2003, Padilla-Parra and Tramier 2012, Algar WR et al. 2019). Intensity-based FRET simplifies the instrumentation requirements but increases the risks of artifacts from experiment design (e.g., imbalanced donor-acceptor relative signals, inner filter effects, donor photobleaching, photochromicity) or is incompatible with dynamic live specimen insights (e.g., sample phototoxicity).
Why should I use TauInteraction?
Fluorescence lifetime imaging microscopy (FLIM)-FRET remains the gold standard approach because the FRET readout depends only on the donor fluorescence lifetime changes, thus circumventing most of the caveats mentioned for intensity-based methods (Padilla-Parra and Tramier 2012; Algar WR et al. 2019). However, the historical complexities of FLIM have limited lifetime-based approaches to specialised groups with a biophysical focus.
Within the lifetime-based approaches, there has been efforts to find more straightforward ways to exploit the FRET effect without complicated physical models. These non-fitting approaches primarily focus on providing the relevant data to better understand the biological system under study (Leray et al 2013). The minimal fraction of donor molecules (mfD) is a simple yet powerful concept that follows this philosophy (Padilla-Parra S et al. 2008, 2011 and Leray et al. 2013). The aim of mfD is to assess the minimal number of molecules involved in FRET. mfD is related to the fraction of interacting donor (fD, Padilla-Parra S et al. 2008). To this end, mfD uses the fluorescence lifetime value from the donor molecule in the absence of the acceptor (figure 1a). From this, it computes the minimal amount of molecules that would have to interact with this donor to account for a given fluorescence lifetime change. With this approach, mfD is particularly suited for an immediate, on the fly readout of the occurrence of interaction based on the minimal relative concentration of interacting proteins.

Figure 1: TauInteraction principle. A) mfD equation, for details see Padilla-Parra S et al. Biophys J. 2008. B) diagram depicting donor (D, green circles) and acceptor (A, red triangles) either separated from each other, half of the molecules interacting or all of them interacting. TauInteraction would yield the percentage of interacting molecules based on mfD .
How can I quantify FRET with TauSense?
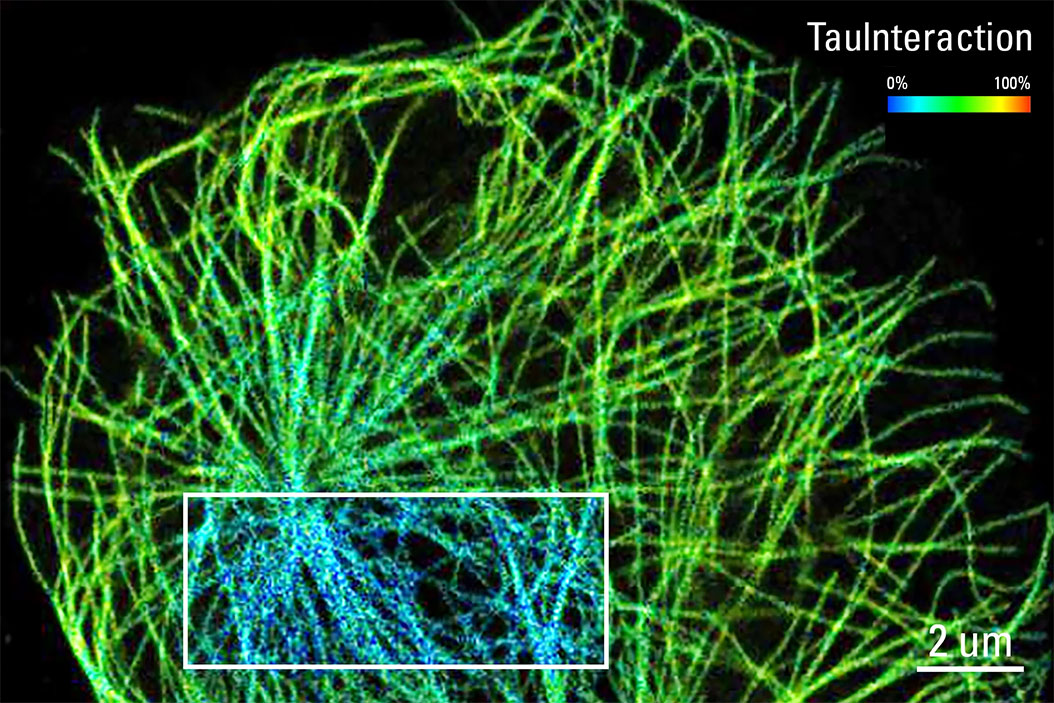
The mfD framework is an excellent fit for the STELLARIS platform owing to its philosophy of direct access to lifetime-based information (figure 1 and ref) provided by TauSense. In order to leverage the fluorescence lifetime potential for a quantitative readout of FRET, we have implemented mfD as a new TauSense tool called TauInteraction. TauInteraction works as follows (figure 1): in a given FRET experiment there may be a number of molecules (donors and acceptors) that will come in close proximity. If these are random events, the average number of molecules undergoing FRET will be negligible. If, on the contrary, there is an active interaction between the molecules, the time that they remain in close proximity will translate into a decreased value of the donor fluorescence lifetime. If this happens, TauInteraction reports on the proportion of the molecules that have contributed to such change. The result is a TauInteraction map with the fraction of interacting molecules at a pixel-by-pixel level, generated on the fly (i.e. during image acquisition). Additionally, the fluorescence intensity of the donor is provided, allowing an independent analysis using intensity-based FRET tools if desired.
As an example of how TauInteraction translates molecular interactions into a quantitative readout, we first evaluated its implementation with a tandem construct to express a donor-acceptor fluorescent proteins pair (eGFP-mCherry) with the proteins linked with a short amino acid sequence (Tramier M et al. 2006). This construct showed a constant positive FRET behaviour in live cells transiently transfected (see figure 2). This is a 27 to 29% of interacting molecules. This is consistent with the maximum observable FRET in biological samples (Padilla-Parra S et al. 2009). If we had distinct donor and acceptor molecules, the proportion of interaction would be lower than this maximum. We can emulate such condition if we lower the amount of acceptor molecules. This is easily achieved by photobleaching some of the mCherry signal. Upon photobleaching some of the acceptor and annihilating the interaction, we observed the overall proportion of molecules interacting in the sample decrease by about 50% (figure 2).
The integration on STELLARIS of TauSense lifetime-based tools such as TauInteraction paves a path for researchers to study FRET processes in a robust and quantifiable manner - with the ultimate goal of obtaining functional answers to biological interactions.

References
- Dunn JD, Alvarez LAJ, Zhang X, Soldati T. Reactive oxygen species and mitochondria: A nexus of cellular homeostasis. Redox Biol. 2015. PMID: 26432659 Free PMC article. Review.
- Förster, T. Transfer Mechanisms of Electronic Excitation Energy. (1960). Radiation Research Supplement 2.
- Jacob F and Monod J. Genetic regulatory mechanisms in the synthesis of proteins. J Mol Biol. 1961 Jun;3:318-56. doi: 10.1016/s0022-2836(61)80072-7. PMID: 13718526 No abstract available.
- Jares-Erijman EA, Jovin TM. Imaging molecular interactions in living cells by FRET microscopy. Curr Opin Chem Biol. 2006 Oct;10(5):409-16. doi: 10.1016/j.cbpa.2006.08.021. Epub 2006 Sep 1. PMID: 16949332 Review.
- Leray A, Padilla-Parra S, Roul J, Héliot L, Tramier M. Spatio-Temporal Quantification of FRET in living cells by fast time-domain FLIM: a comparative study of non-fitting methods. PLoS One. 2013 Jul 18;8(7):e69335. doi: 10.1371/journal.pone.0069335. Print 2013. PMID: 23874948
- Padilla-Parra S, Audugé N, Coppey-Moisan M, Tramier M. Quantitative FRET analysis by fast acquisition time domain FLIM at high spatial resolution in living cells. Biophys J. 2008 Sep 15;95(6):2976-88. doi: 10.1529/biophysj.108.131276. Epub 2008 Jun 6. PMID: 18539634
- Padilla-Parra S, Audugé N, Lalucque H, Mevel JC, Coppey-Moisan M, Tramier M. Quantitative comparison of different fluorescent protein couples for fast FRET-FLIM acquisition. Biophys J. 2009 Oct 21;97(8):2368-76. doi: 10.1016/j.bpj.2009.07.044.
- Padilla-Parra S, Auduge N, Coppey-Moisan M, Tramier M. Non fitting based FRET-FLIM analysis approaches applied to quantify protein-protein interactions in live cells. Biophys Rev. 2011 Jun;3(2):63-70. doi: 10.1007/s12551-011-0047-6. Epub 2011 May 17. PMID: 28510004
- Padilla-Parra S, Tramier M. FRET microscopy in the living cell: different approaches, strengths and weaknesses. Bioessays. 2012 May;34(5):369-76. doi: 10.1002/bies.201100086. Epub 2012 Mar 13. PMID: 22415767 Review.
- Pietraszewska-Bogiel A, Gadella TW. FRET microscopy: from principle to routine technology in cell biology. J Microsc. 2011 Feb;241(2):111-8. doi: 10.1111/j.1365-2818.2010.03437.x. Epub 2010 Sep 27. PMID: 21118231 Free article. Review.
- Pires BRB, Silva RCMC, Ferreira GM, Abdelhay E. NF-kappaB: Two Sides of the Same Coin. Genes (Basel). 2018 Jan 9;9(1):24. doi: 10.3390/genes9010024.
- Schlessinger K, Hall A, Tolwinski N. Wnt signaling pathways meet Rho GTPases. Genes Dev. 2009 Feb 1;23(3):265-77. doi: 10.1101/gad.1760809.
- Tramier M, Zahid M, Mevel JC, Masse MJ, Coppey-Moisan M. Sensitivity of CFP/YFP and GFP/mCherry pairs to donor photobleaching on FRET determination by fluorescence lifetime imaging microscopy in living cells. Microsc Res Tech. 2006 Nov;69(11):933-9. doi: 10.1002/jemt.20370.
- Valeur, B. Molecular Fluorescence: Principles and Applications. Methods vol. 8 (2001).
- Vidya MK, Kumar VG, Sejian V, Bagath M, Krishnan G, Bhatta R. Toll-like receptors: Significance, ligands, signaling pathways, and functions in mammals. Int Rev Immunol. 2018 Jan 2;37(1):20-36. doi: 10.1080/08830185.2017.1380200. Epub 2017 Oct 13. PMID: 29028369. Review.
- Yan L, Lamb RF. Signalling by amino acid nutrients. Biochem Soc Trans. 2011 Apr;39(2):443-5. doi: 10.1042/BST0390443. PMID: 21428916. Review.
- Zhang W, Liu HT. MAPK signal pathways in the regulation of cell proliferation in mammalian cells. Cell Res. 2002 Mar;12(1):9-18. doi: 10.1038/sj.cr.7290105.
Related Articles
-

Extended Live-cell Imaging at Nanoscale Resolution
Extended live-cell imaging with TauSTED Xtend. Combined spatial and lifetime information allow…
Mar 05, 2024Read article -
 dataset, showing the biochemically distinct structures of a fresh, untreated apple slice.")
How to Prepare Samples for Stimulated Raman Scattering (SRS) imaging
Find here guidelines for how to prepare samples for stimulated Raman scattering (SRS), acquire…
Feb 05, 2024Read article -
Coherent Raman Scattering Microscopy Publication List
CRS (Coherent Raman Scattering) microscopy is an umbrella term for label-free methods that image…
Sep 11, 2023Read article