
Get more insights from large 2D images
In Aivia 13, significant improvements have been made to the visualization engine. This allows users to view large, multiplexed 2D images (85K x 57K in size with 30 channels) and millions of detected objects. The new Mini-Map feature helps researchers navigate to their region of interest from anywhere in their image. Automatic tissue detection enables users to automatically delineate Regions of Interest (ROI) based on any channels for efficient downstream analyses of large tissue sections and Tissue Micro Array (TMA) cores.
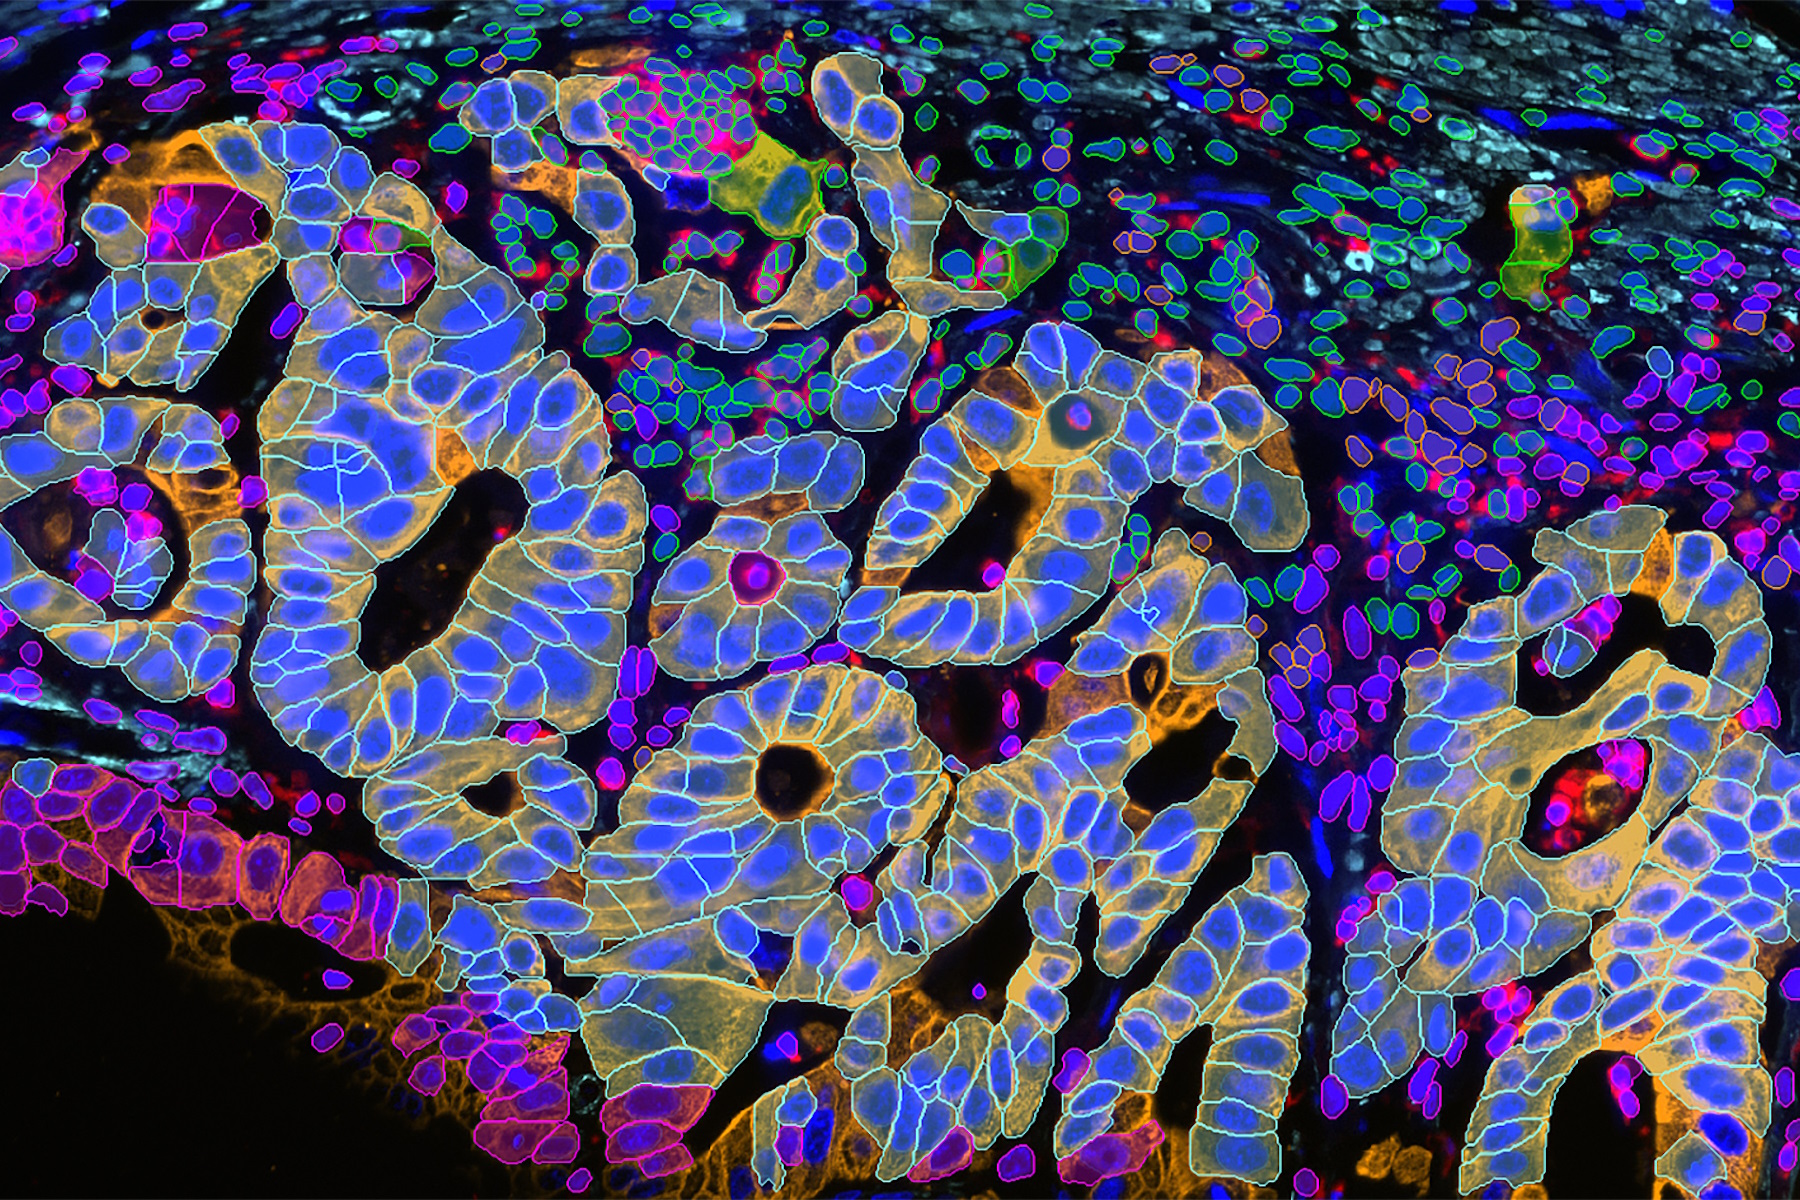
Additionally, Aivia offers two new recipes for cell detection: Cell Analysis - Cellpose and Multiplexed Cell Detection, to provide an accurate understanding of your data. Both recipes incorporate an optimized version of the Cellpose generalist deep learning cell segmentation algorithm [1], which has been demonstrated to accurately segment cells with diverse morphological characteristics.
Expert- and data-driven phenotyping
Understanding the types of cells in your image is critical to gaining deep insights. Aivia’s AI-driven Phenotyper leverages your expert knowledge of the phenotypes present in your data to build a classifier. Simply select a few representative cells to train Aivia and Aivia will classify cells into different phenotypes automatically.
Aivia has two automatic clustering choices, k-means clustering [2] and PhenoGraph-Leiden [3] unsupervised automatic clustering methods, which only need a few user-guided inputs. These methods can generate traits that include intensity and morphological measurements for up to 30 biomarkers, aiding in data-driven phenotyping.

Complex Spatial Data Exploration
When working with millions of objects in large, multiplexed 2D images, it's essential to conduct a thorough quantitative analysis of various entities and characteristics, and to juxtapose them for comparison. Aivia now provides new charts optimized for data exploration of millions of objects.
In this new release of Aivia, an overview of data is generated for different hierarchical levels, which enables users to analyze the measurements for each phenotype and compare them across phenotypes. Dimensionality reduction is a mathematical method to gain better understanding and insights into data with a high number of dimensions by reducing them to two dimensions. Aivia 13 provides three unique methods for executing dimensionality reduction, including UMAP, PaCMAP, and t-SNE. In addition, Aivia allows users to observe their clusters or phenotypes in the plot of dimensionality reduction.
Want to learn more? Register below to watch the full webinar presented by Quyen Tran, Ph.D.
References
- Stringer C, Wang T, Michaelos M, and Pachitariu M. Cellpose: a generalist algorithm for cellular segmentation. Nature Methods. 18: 100-106. (2021)
- MacQueen, J. Some methods for classification and analysis of multivariate observations. Proceedings of the 5th Berkeley Symposium on Mathematical Statistics and Probability. Vol. 1: Statistics. 281-297. (1967).
- Traag VA, Waltman L, and van Eck NJ. From Louvain to Leiden: guaranteeing well-connected communities. Scientific Reports. 9: 5233. (2019).
Related Articles
-

Exploring Subcellular Spatial Phenotypes with SPARCS
Discover spatially resolved CRISPR screening (SPARCS), a platform for microscopy-based genetic…
Sep 26, 2023Read article -

Unlocking Insights in Complex and Dense Neuron Images Guided by AI
The latest advancement in Aivia AI image analysis software provides improved soma detection,…
Jun 16, 2023Read article -

AI Microscopy Enables the Efficient Detection of Rare Events
Localization and selective imaging of rare events is key for the investigation of many processes in…
Jun 06, 2023Read article