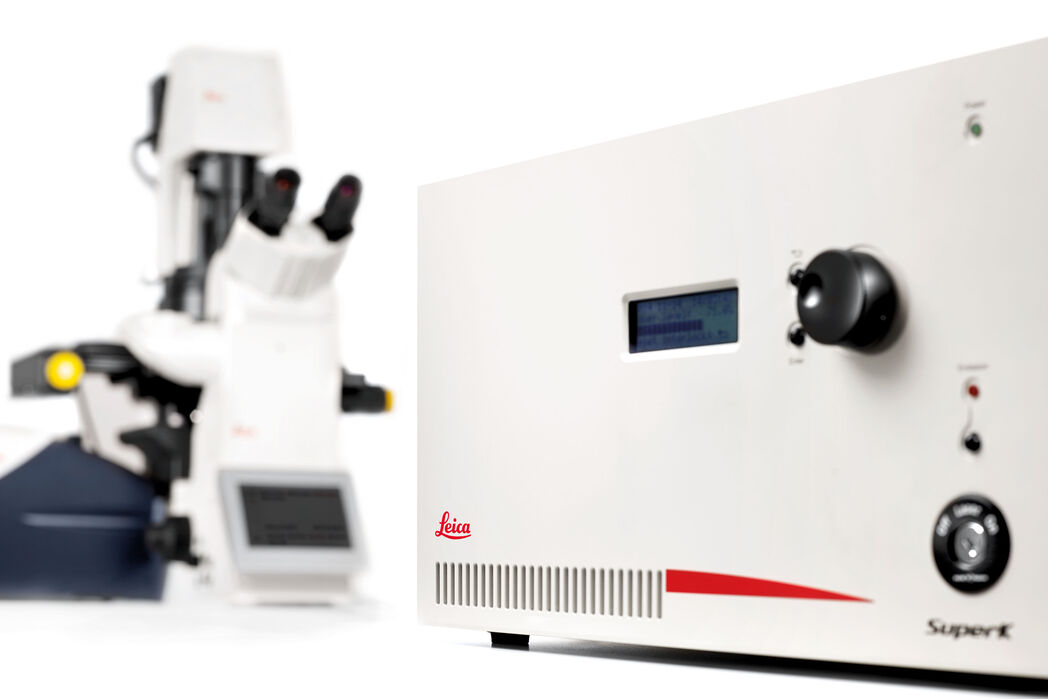
TCS SP8 X White Light Laser Confocal Microscope
Spectral Characterization of Images
The white light laser source of the Leica TCS SP8 X perfectly matches the wavelength of any fluorophore. Up to eight excitation lines can be used – simultaneously. By tuning both excitation and detection, complete excitation emission spectra can be acquired.
With this spectral information, any dye can be optimally excited with minimum cross-excitation and specimen damage. In addition, the pulsed White Light Laser (WLL) supplies excitation light for fluorescence lifetime measurements.
FLIM provides information about the direct environment of a molecule, like local pH or binding to another molecule.

