STELLARIS FALCON FLIM Microscope
The contrast is clear. Lifetime imaging in an instant.
STELLARIS FALCON (FAst Lifetime CONtrast) is the future of functional imaging. Harness the power of fluorescence lifetime to investigate cellular physiology and explore dynamics in living cells. STELLARIS FALCON is a fully integrated solution for Fluorescence Lifetime Imaging (FLIM) and enables video-rate lifetime imaging acquisition for rapid kinetic studies in live cells.
STELLARIS FALCON adds a new dimension of contrast to your imaging, opening the door to biosensing and tracking of interactions between proteins. FLIM information is now available for all modalities of the STELLARIS system.
Now you can:
- Follow fast molecular interactions via FLIM-FRET (Förster Resonance Energy Transfer)
- Use biosensors to detect changes in metabolic state and microenvironment
- Apply lifetime contrast to separate multiple fluorophores
- Acquire FLIM data with minimal training
Follow molecular interactions with FLIM-FRET
Modern research investigates how molecules interact to accomplish vital tasks. FLIM-FRET is the gold standard to explore these interactions.
STELLARIS FALCON sets a new speed standard for FLIM instruments.
It enables FRET in highly dynamic cellular events. You can acquire and interpret FRET data in your daily experiments.
Monitor subtle and fast changes with biosensors
Biosensors are powerful reporters for metabolic activity, signaling mechanisms, pH and microenvironment changes.
STELLARIS FALCON provides access to information contained in fluorescence lifetime, even for ultrafast events such as membrane potential dynamics. This information complements the spectral fluorescent intensity imaging and TauSense modes delivered by the STELLARIS system.
More reliable and sensitive metabolic imaging
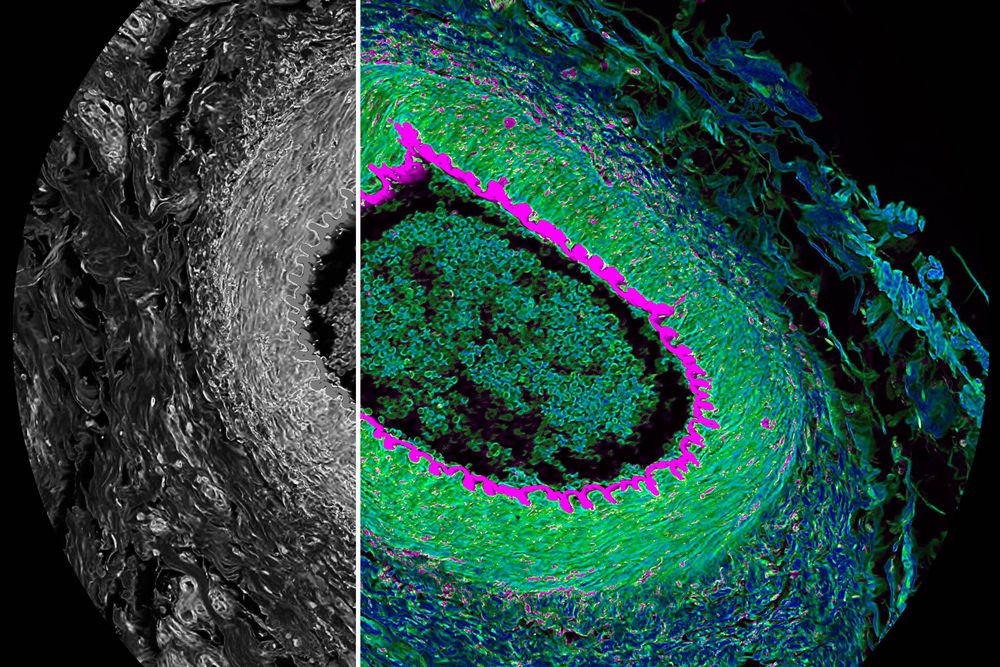
Autofluorescence can be an issue in conventional imaging. STELLARIS FALCON turns it into valuable information. You can now transform autofluorescence into a reporter for metabolic status, cell differentiation, and cancer development.
Moreover, STELLARIS FALCON enables imaging contrast in living tissue, where fluorescence labeling is often unspecific or destroys physiological conditions.
Fluorophore separation beyond the spectral options
Fluorescence labeling is the standard way to differentiate intracellular structures. Spectral separation is very powerful, but sometimes limited when the emission spectra are too close.
With STELLARIS FALCON, you can exploit the full potential of fluorescence lifetime imaging to separate multiple fluorescent probes using exponential fitting, pattern fitting and the new FLIM phasor separation analysis.
Interactive image: Cytoskeleton structures distinguished by lifetime contrast. Vimentin immunolabeled with Alexa Fluor 555 (green), and tubulin immunolabeled with Alexa Fluor 546 (blue). The fluorophores are spectrally very similar, but they are separated using the fluorescence lifetime information. Image size: 512 x 512 pixels.


STELLARIS FALCON for fast lifetime imaging
The STELLARIS FALCON microscope overcomes the speed limitation of FLIM and opens the door to fast lifetime data.
Up to now, functional information extracted from fluorescence lifetime data of fast processes was hard to get due to the technical constraints of FLIM. FLIM acquisition speed was at least 10 times slower than recording the confocal intensity.
Using STELLARIS FALCON fast lifetime contrast imaging, you can follow dynamic processes in cells at the appropriate pace. These tasks are possible thanks to a new way to measure time using TCSPC (Time-Correlated Single Photon Counting) together with intelligent algorithms for data handling and analysis.
Application note in Nature: SP8 FALCON: a novel concept in fluorescence lifetime imaging enabling video-rate confocal FLIM
All-in-one multimodal imaging
Combining FLIM with other modalities was never as easy as with the STELLARIS FALCON. Until now, researchers had to cope with complex wiring and cumbersome file transfer tasks. With STELLARIS FALCON, you can integrate lifetime information into your standard confocal workflow.
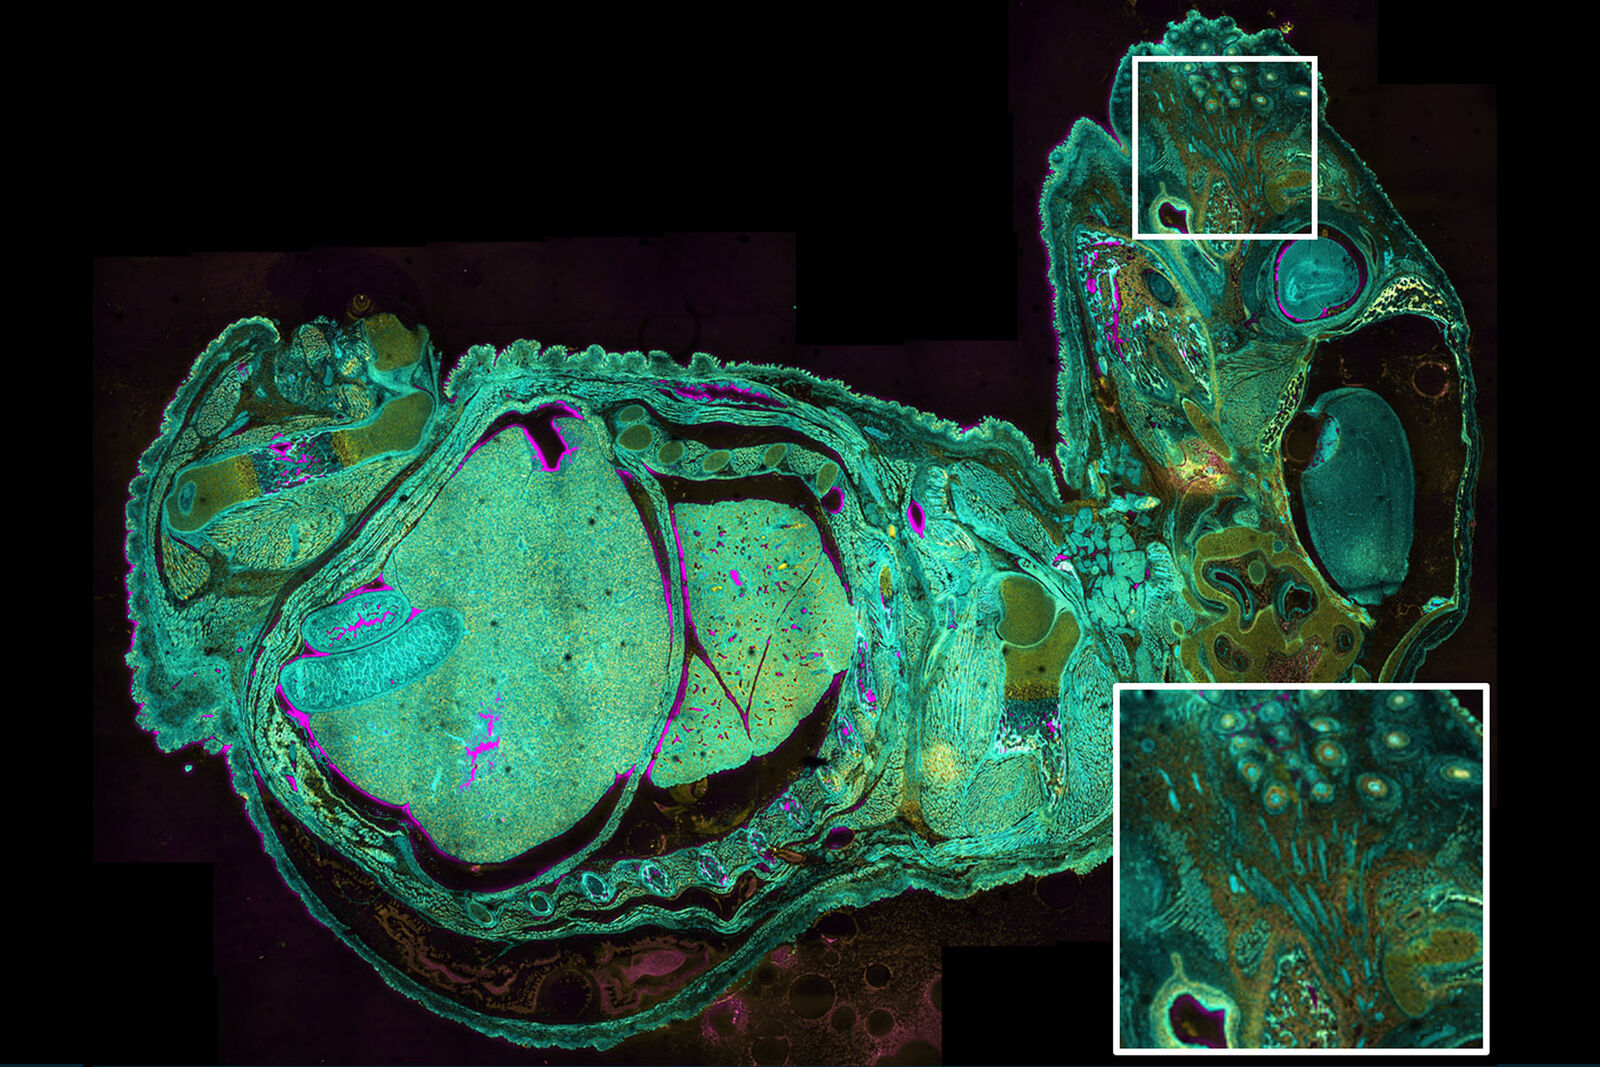
STELLARIS FALCON is fully integrated in the LAS X acquisition and analysis software. It can record FLIM in four spectral channels simultaneously and up to 10 channels sequentially. STELLARIS FALCON gives you access to lifetime contrast in 3D-stacks, time-lapse sequences, and even large mosaic-tiling formats.
With LAS X NAVIGATOR, you can expand your viewing area up to 10,000 times, saving precious time in identifying your regions of interest and exploring your samples in a whole new way.
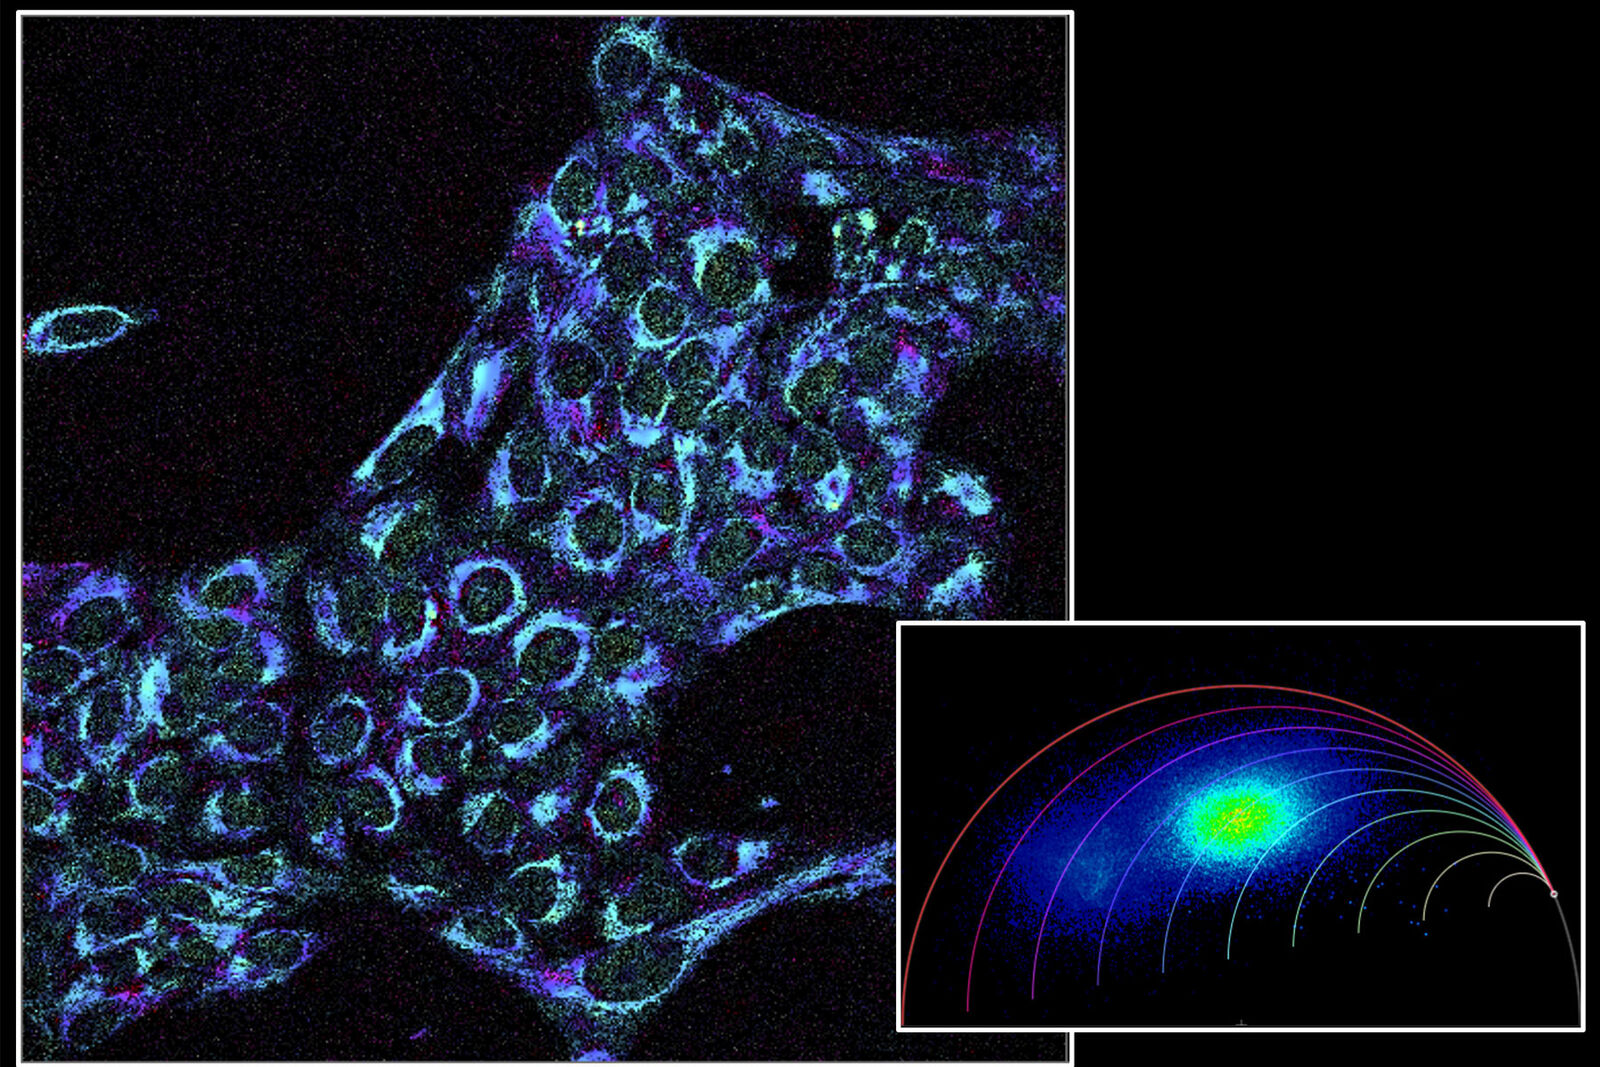
Straightforward lifetime definition with phasors
Analysis with STELLARIS FALCON using FLIM phasors provides a 2D visualization of lifetime components. With FLIM phasors you can follow microenvironmental changes, select components to multiplex signal and determine FRET efficiency.

The results you need – with one click
The LAS X software enables FLIM with a click and the same philosophy as the routine spectral imaging.
Even if you use microscopy as a complementary technique, you can find the essentials and start imaging right away.
More specialized functions are accessible as workflows and allow automation for your convenience.

