
The FRET phenomenon
Fluorescence describes the spontaneous emission of a photon from a molecule or atom after excitation of the electronic system by absorption of light. The emitted photon usually has less energy as compared to the excitation photon and consequently has a longer wavelength (Stokes shift). Blue excitation may for example cause green emission. If a second fluorescent molecule can absorb the green photon, the emission of that molecule is again Stokes-shifted, e.g. into red color. This re-absorption is partially responsible for errors in measuring fluorescence (part of "inner filter" effects) in comparably densely concentrated samples. In weakly concentrated samples, re-absorption is a very rare event.
If the two molecules are spatially very close (a few nanometers), the energy can “hop” directly from the "donor" to the "acceptor" without occurrence of light. This direct exchange of energy is called "Förster Resonance Energy Transfer", FRET. "Resonance" indicates that the two molecules have to share energetic windows. The windows are the emission spectrum of the donor and the absorption spectrum of the acceptor. Although photons are neither emitted nor re-absorbed, the energetic considerations still hold. The probability for FRET rises with the overlap area of the two spectra – more energy wins through if the windows fit better. Also, the orientation of the molecules has an influence on the transfer efficiency.
For the example given above, the collected emission is normally green if the sample is illuminated with blue light. If FRET occurs, red photons will also be emitted – and fewer green photons accordingly. The extreme case would be a complete transfer of all energy and no green emission at all. The FRET efficiency, defined by the number of absorbed blue photons divided by the number of emitted red photons, can consequently assume values from 0 to 1. For a given FRET pair, the FRET efficiency indicates the spatial distance between the two fluorescent species – this is the goal of FRET measurements [2].
As FRET requires a very short distance between fluorochromes, it is a tool for verifying interactions of cellular components. Although a biological interaction cannot be proved by measuring the sheer distance, FRET increases the colocalization accuracy down to a few nanometers. Dimerization processes and conformational changes of proteins are also targets of this method [3]. An area of indirect applications is provided by FRET biosensors that change their FRET efficiency upon interaction with the perceived target. A very prominent example is the Cameleon biosensor for probing Ca2+ concentration changes [4].
Förster Radius and FRET pairs
The Förster radius R0 is the distance between a pair of fluorochromes at which the FRET efficiency reaches ½ (i.e. 50 %). Typically, this distance is in the range of 20 …60 Å (2 … 6 nm). The Förster radius R0 depends on the photophysical parameters of the FRET pair [5]:
with
kappa2: orientation factor
J(λ): overlap integral
n: refractive index
QD: quantum yield of donor
FRET efficiency E as depending on the distance between the fluorochromes is expressed by the following formula:

with
R0: Förster radius
r: Donor-acceptor distance
If the Förster radius for a given FRET pair is known, the measured FRET efficiency reveals the distance r between the two fluorochromes. Obviously, the measurement is very critical, due to the 6th power involved in the dependence of efficiency on distance. In turn, all calculations of distances should not be overstated. Nevertheless, measuring FRET efficiency changes in living samples can reveal direct indications for changes in interactivity, transport phenomena and other cellular events.
In living cells the dyes of choice are usually GFP variants, whereas in fixed preparations the dyes used range from antibody-tagged dyes to GFP variants or a combination of both. Figure 2 shows a couple of commonly used FRET pairs. There are many more options, and with the daily increasing number of new dyes and fluorescent proteins, this area is becoming increasingly crowded. Dyes of similar spectral properties are interchangeable and all kinds of permutations are possible.
| Donor | Acceptor | R0 (Å) |
|---|---|---|
| Fluorescein | Tetramethylrhodamin | 55 |
| Cy3 | Cy5 | >50 |
| CFP | YFP | 50 |
| BFP | GFP | 40 |
| CFP | GFP | 48 |
| GFP | YFP | 57 |
Methods for measuring FRET efficiencies
The most direct way to measure FRET effects is the FRET-AP method. Here, the sample that is supposed to show FRET is imaged for the donor. In the example given before, this refers to the experiment with blue excitation and collecting green emission. After collecting an image, an area of interest is intensely illuminated by light that can photobleach the acceptor (hence “AP”, acceptor photobleaching), but does not damage the donor. Then, a second image of the donor is taken. If there was FRET, the donor should show an increased intensity in the bleached region, as there are more molecules ready for donor fluorescence and not drained into the FRET channel. The FRET efficiency E is estimated by the following formula:

with
• DA: donor-intensity before bleaching
• DΩ: donor-intensity after bleaching
The AP method is restricted to fixed samples, as images are taken serially. This takes time and living samples would change structurally or move away. A method that improves results in live sample experiments is called FRET-SE, for "sensitized" emission. Sensitized refers to the fact that acceptor molecules start to emit upon donor excitation as soon as FRET is possible. In this method, all fluorescence channels are collected simultaneously. Based on previously collected correction factors, FRET images are calculated from the different parallel images. Although this method enables inspection of living material, the correction is prone to errors and solid results require very meticulous experimenting [1, 5].
Besides measuring intensity changes, measurements of fluorescent lifetime can also reveal FRET occurrence. The excited state of the donor decays by emitting a photon back to the ground state. If no FRET occurs, the fluorescence lifetime describes these single-path decay kinetics. If the excited state can also decay into a FRET channel, the lifetime shortens – because there is a second option speeding up the clearance of the excited state. Measuring the altered lifetime and extraction of the kinetic contributions also allows estimation of FRET efficiencies. This method is referred to as "FLIM-FRET" [6].
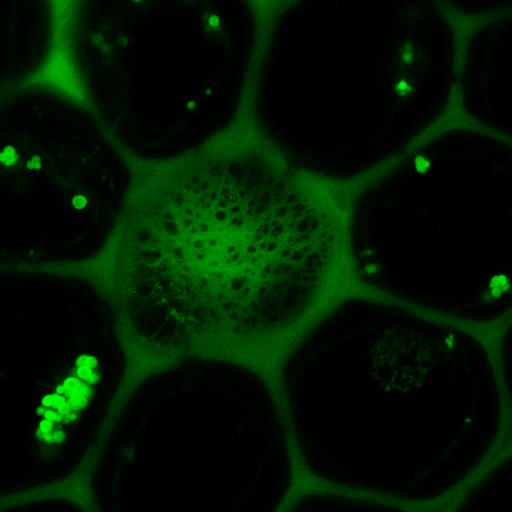
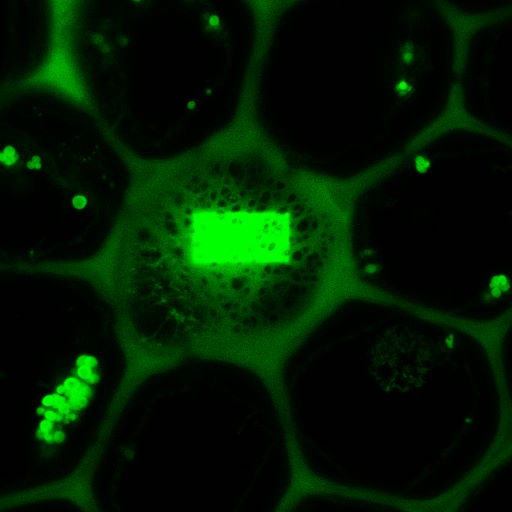
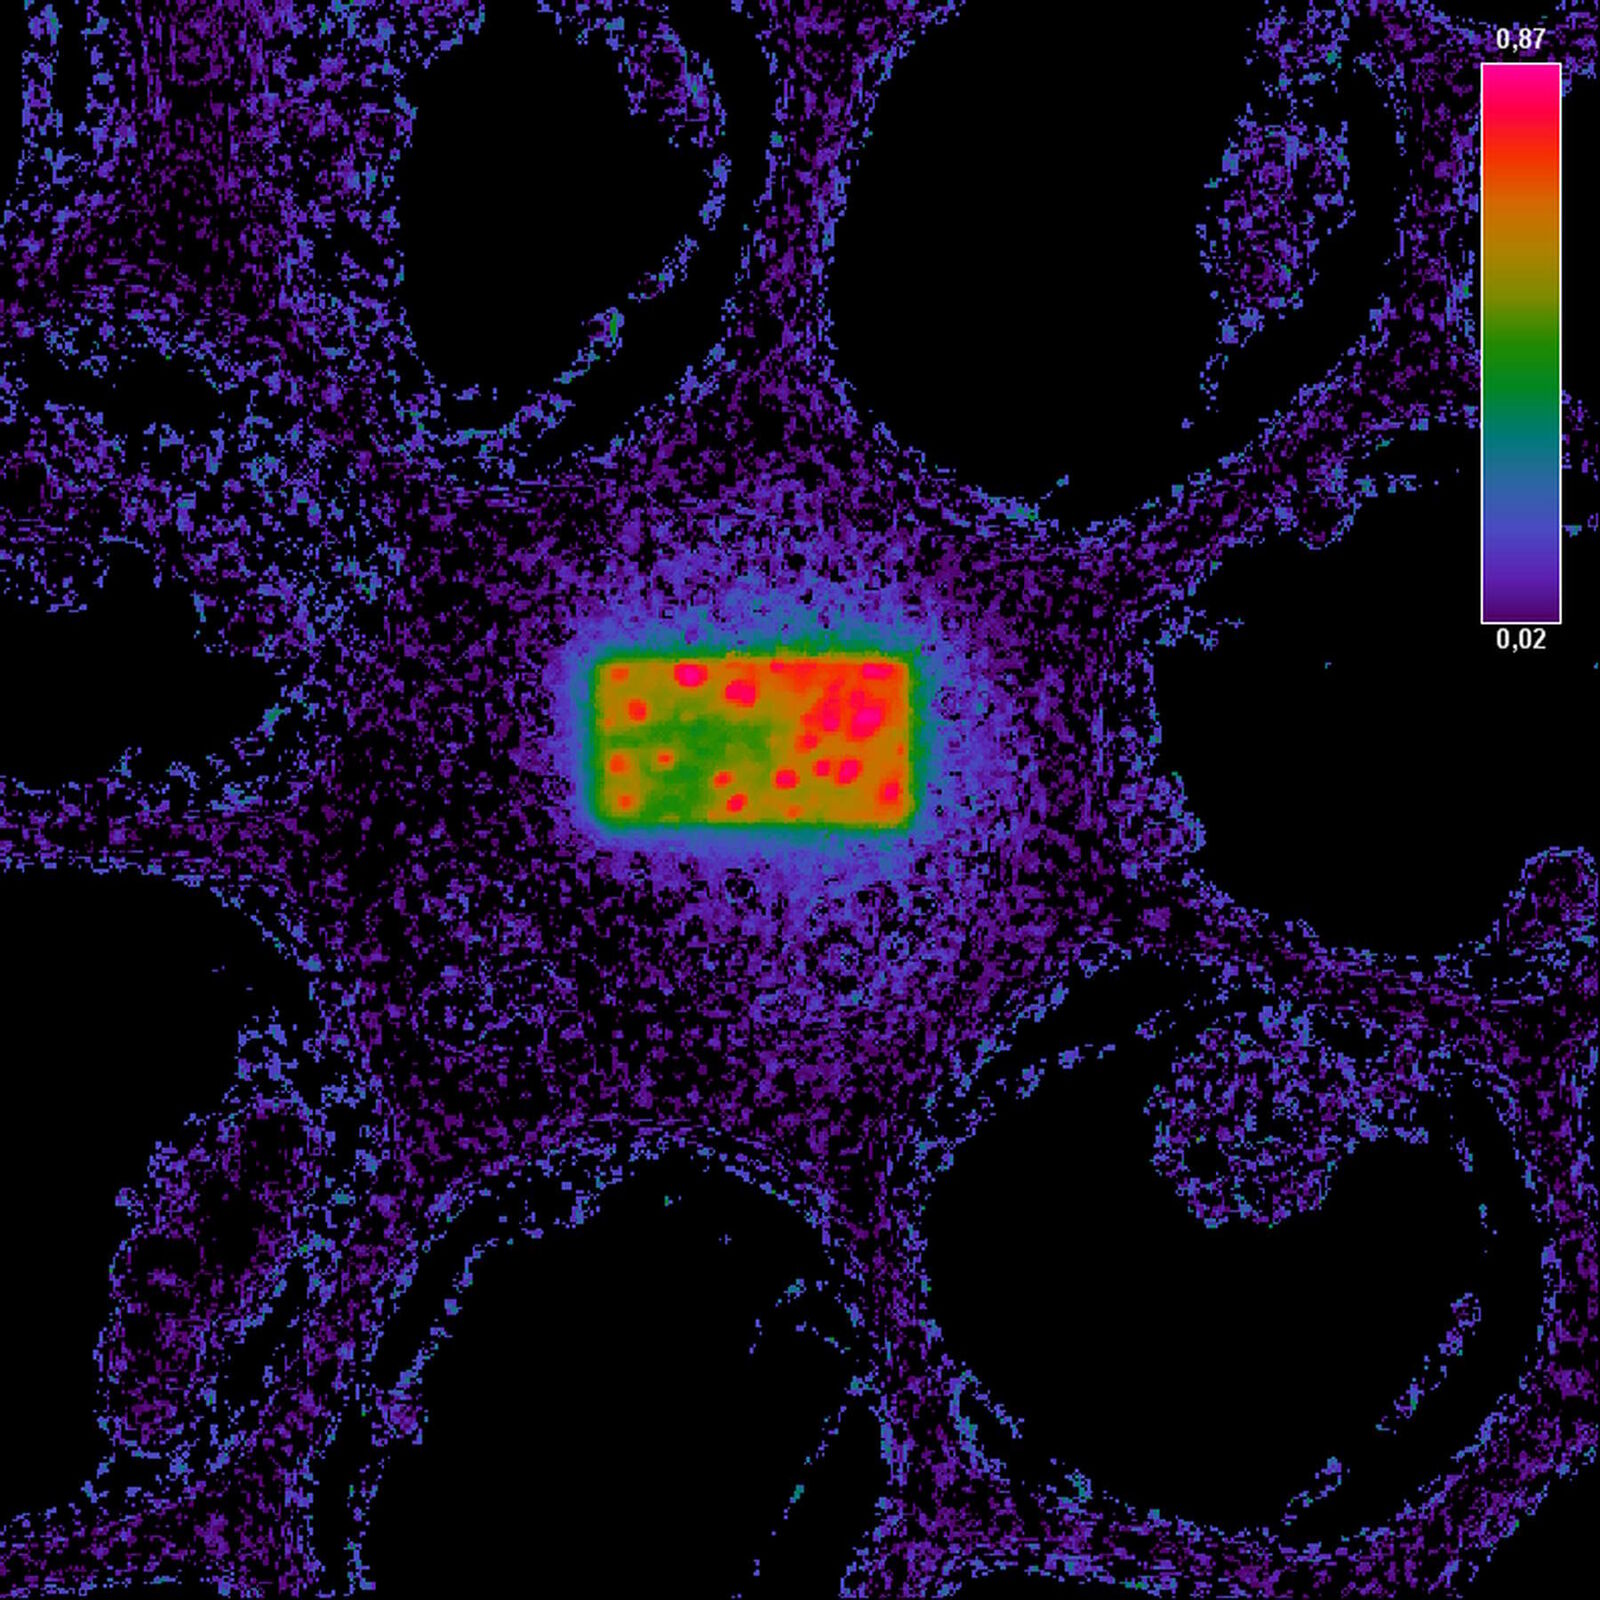
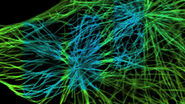
Fig. 3: Example of FRET Acceptor Photobleaching. On the left, the donor image is shown before photobleaching.
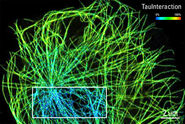
The middle image shows the same field after bleaching the acceptor in a small rectangular region. In this region, the donor emission is increased, as all excited molecules can only decay by emitting a fluorescence photon. The darker fluorescence in the surrounding area indicates “leakage” of fluorescence into the FRET channel.
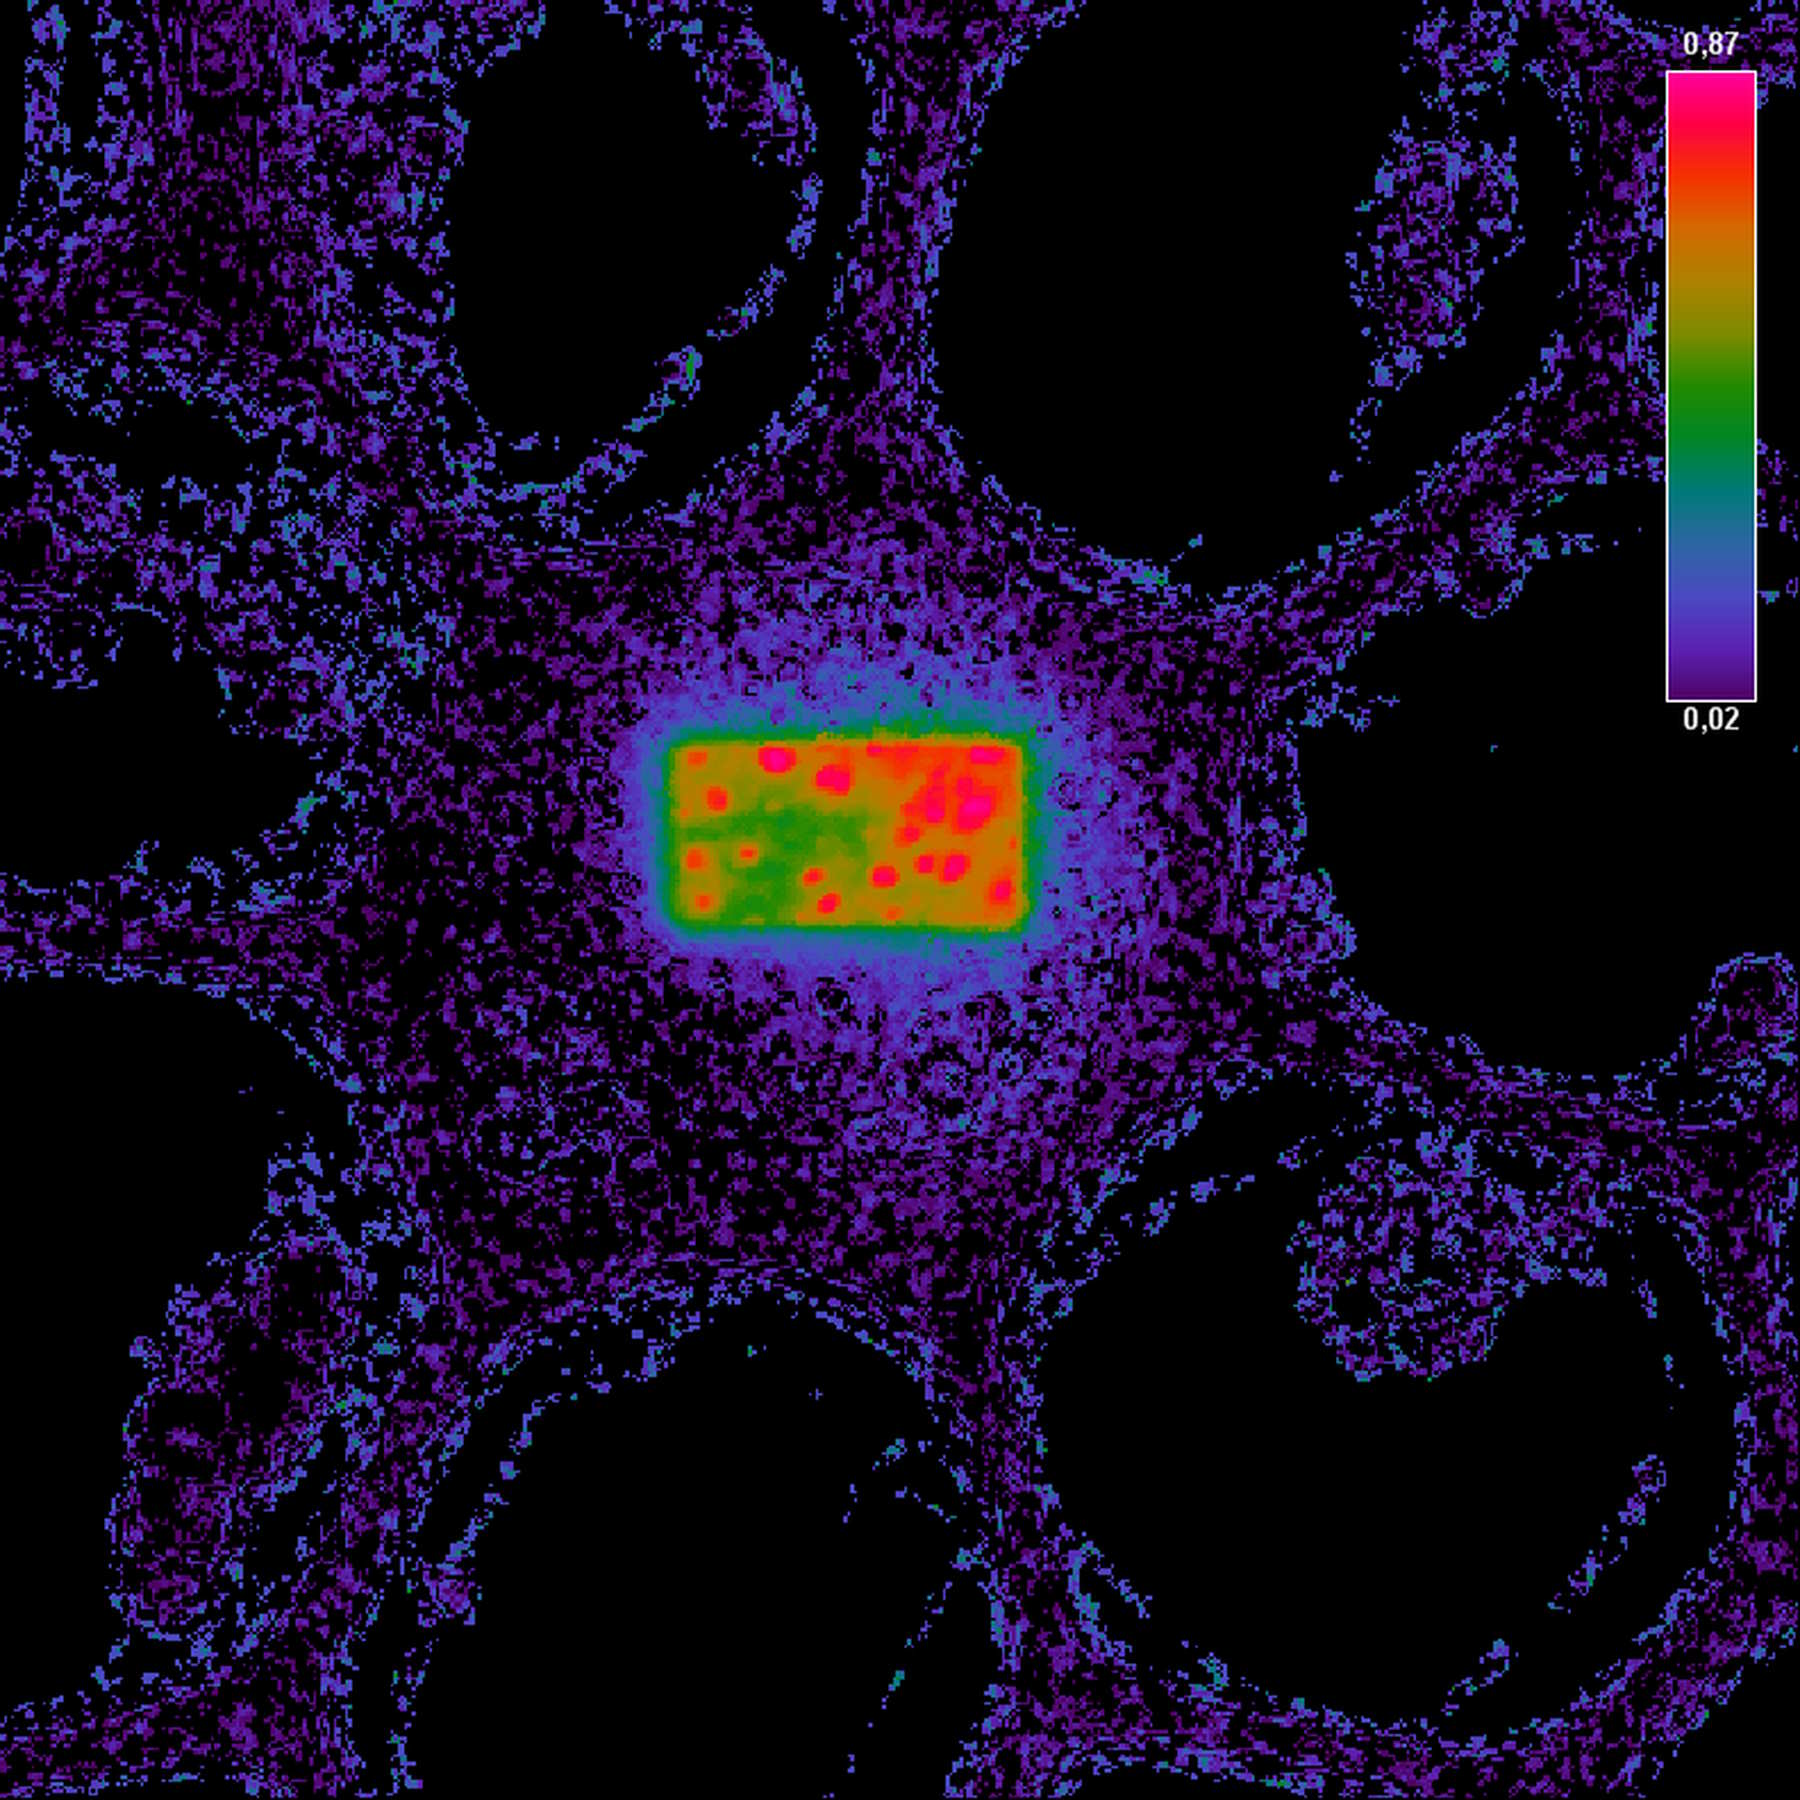
The false-color image on the right side is calculated according to the formula for FRET efficiency. The higher intensity in the rectangular region accounts for the FRET efficiency that occurred before the area was bleached. The background does not contain any FRET efficiency information.
References
- Lippincott-Schwartz J, Snapp E and Kenworthy AK: Studying protein dynamics in living cells. Molecular Cell Biology 2 (2001) 444–56.
- Förster T: Intermolecular Energy Migration and Fluorescence. Ann Phys 2 (1948) 55–75.
- Gadella TWJ, van der Krogt GNM, Bisseling T: GFP-based FRET microscopy in living plant cells. Trends Plant Sci4:7 (1999) 287–91.
- Miyawaki et al.: PNAS 96 (1999) 2135.
- Bastiaens PI and Pepperkok R: Observing proteins in their natural habitat: the living cell. Trends Biochem Sci 25 (2000) 631–37.
- Zimmermann T. et al.: Spectral imaging and linear un-mixing enables improved FRET efficiency with a novel GFP2-YFP pair. FEBS letters 245–49 (2002).
 and acceptor (A) molecule which participate in FRET (Förster resonance energy transfer).")