
Visualizing ingredient distribution
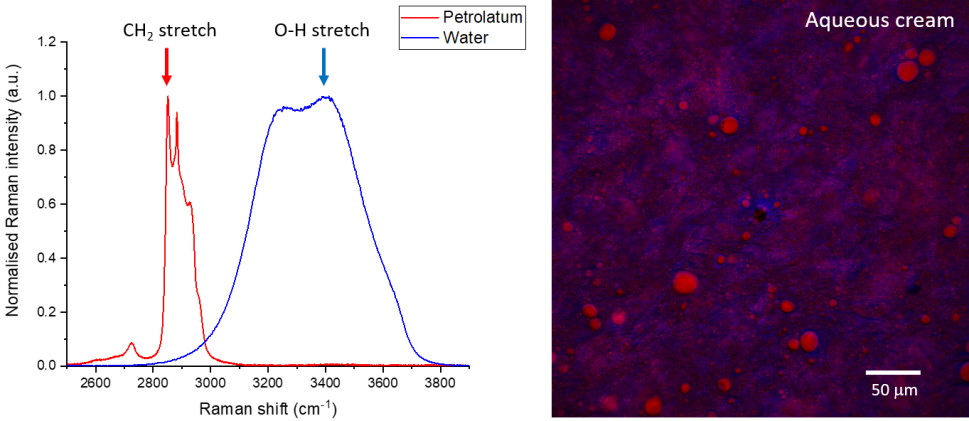
Stimulated Raman scattering (SRS) and Coherent anti-Stokes Raman scattering (CARS) can provide label-free chemical information with high spatial and temporal resolution, meaning that these techniques are ideally suited to visualize the formulated product structure, including monitoring the fate of individual ingredients during use. Individual ingredients can be imaged by selecting the appropriate Raman shifts for SRS contrast either from a pre-existing Raman spectrum of the individual ingredients (Figure 1, left), or from an SRS spectrum generated by acquiring a lambda scan (see below, and the example presented in Figure 3).
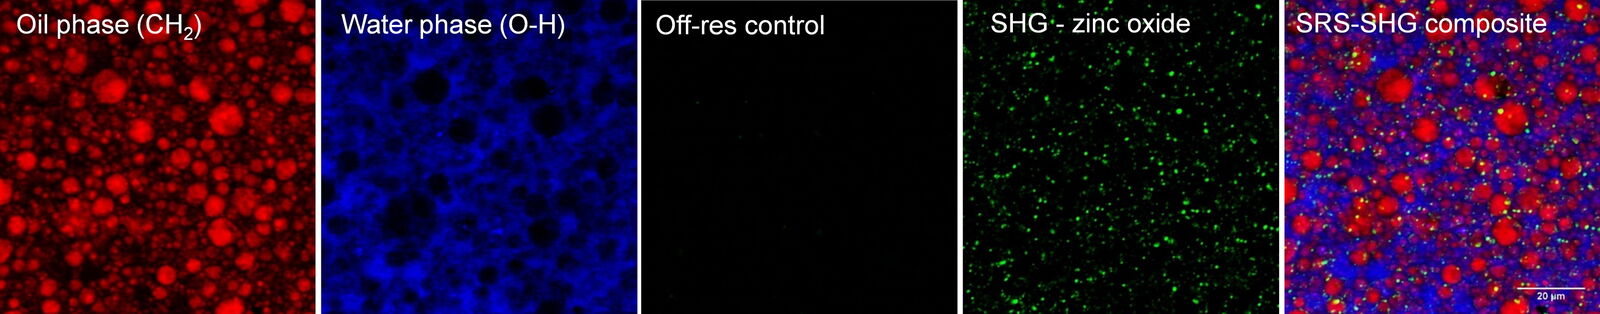
In addition to these contrast wavenumbers, an additional control image should also be acquired ‘off-resonance’ at a nearby wavenumber where no Raman intensity is expected (see example in Figure 2). This is to ensure that the signals being detected are Raman-based and enables the identification of any spurious signals such as artefacts from laser absorption. After the images have been acquired at the desired wavenumbers for each ingredient/phase, the images can be merged to build a composite image which enables an understanding of the correlation between different components in the material. In addition to SRS contrast, it is useful to simultaneously image additional structural information by using methods such as second harmonic generation or fluorescence. The images presented in Figure 2 reveal the oil vs the water phase distribution in a sample of sunscreen imaged with SRS in addition to the zinc oxide particles which were visualized using SHG.
Generating SRS spectra to provide chemical and structural information
SRS spectra can be generated by performing a lambda scan during which SRS images are captured at very small incremements in wavelength of the pump beam in order to generate a stack of images that span a wavenumber range of interest. The video and figure 3 display such a lambda scan image stack acquired on a pharmaceutical skin formulation which contains multiple active ingredients. As the pump beam is swept through the wavelengths corresponding to the fingerprint region of the Raman spectrum, different ingredients are excited in turn as their wavenumbers are stimulated. Once this stack of images has been acquired, features can be selected to generate regions of interest (ROIs). From these ROIs, SRS spectra are generated by plotting ROI SRS signal intensity vs wavelength of the pump beam (which can be converted to wavenumber). Sometimes it can be helpful to generate a maximum projection of all the images in the wavelength stack, to visualize all the features in one single image and ensure no important features have been missed.
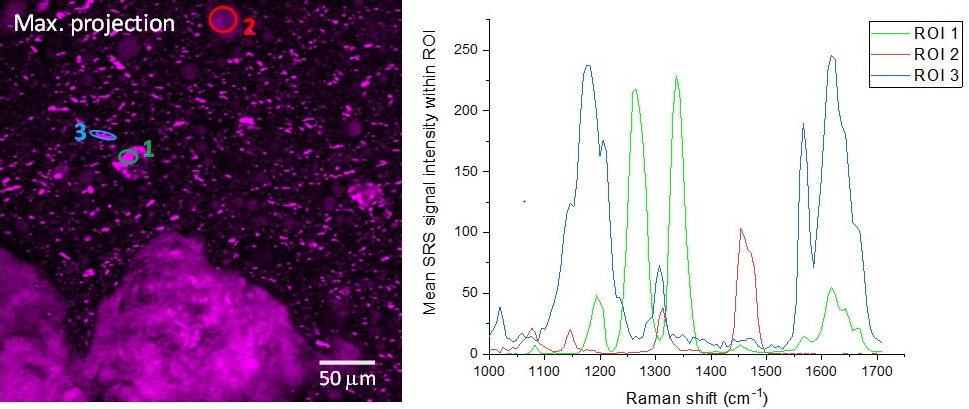
Once the SRS spectra have been generated from the lambda scan, these can be compared to the spontaneous Raman spectra of the individual ingredients. The spectral information coupled with the morphological information from the images can offer a valuable tool for formulation troubleshooting, such as identifying the presence of polymorphs, co-crystals or oxidation products.
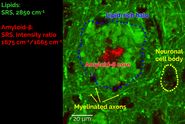
Visualizing ingredient permeation into skin
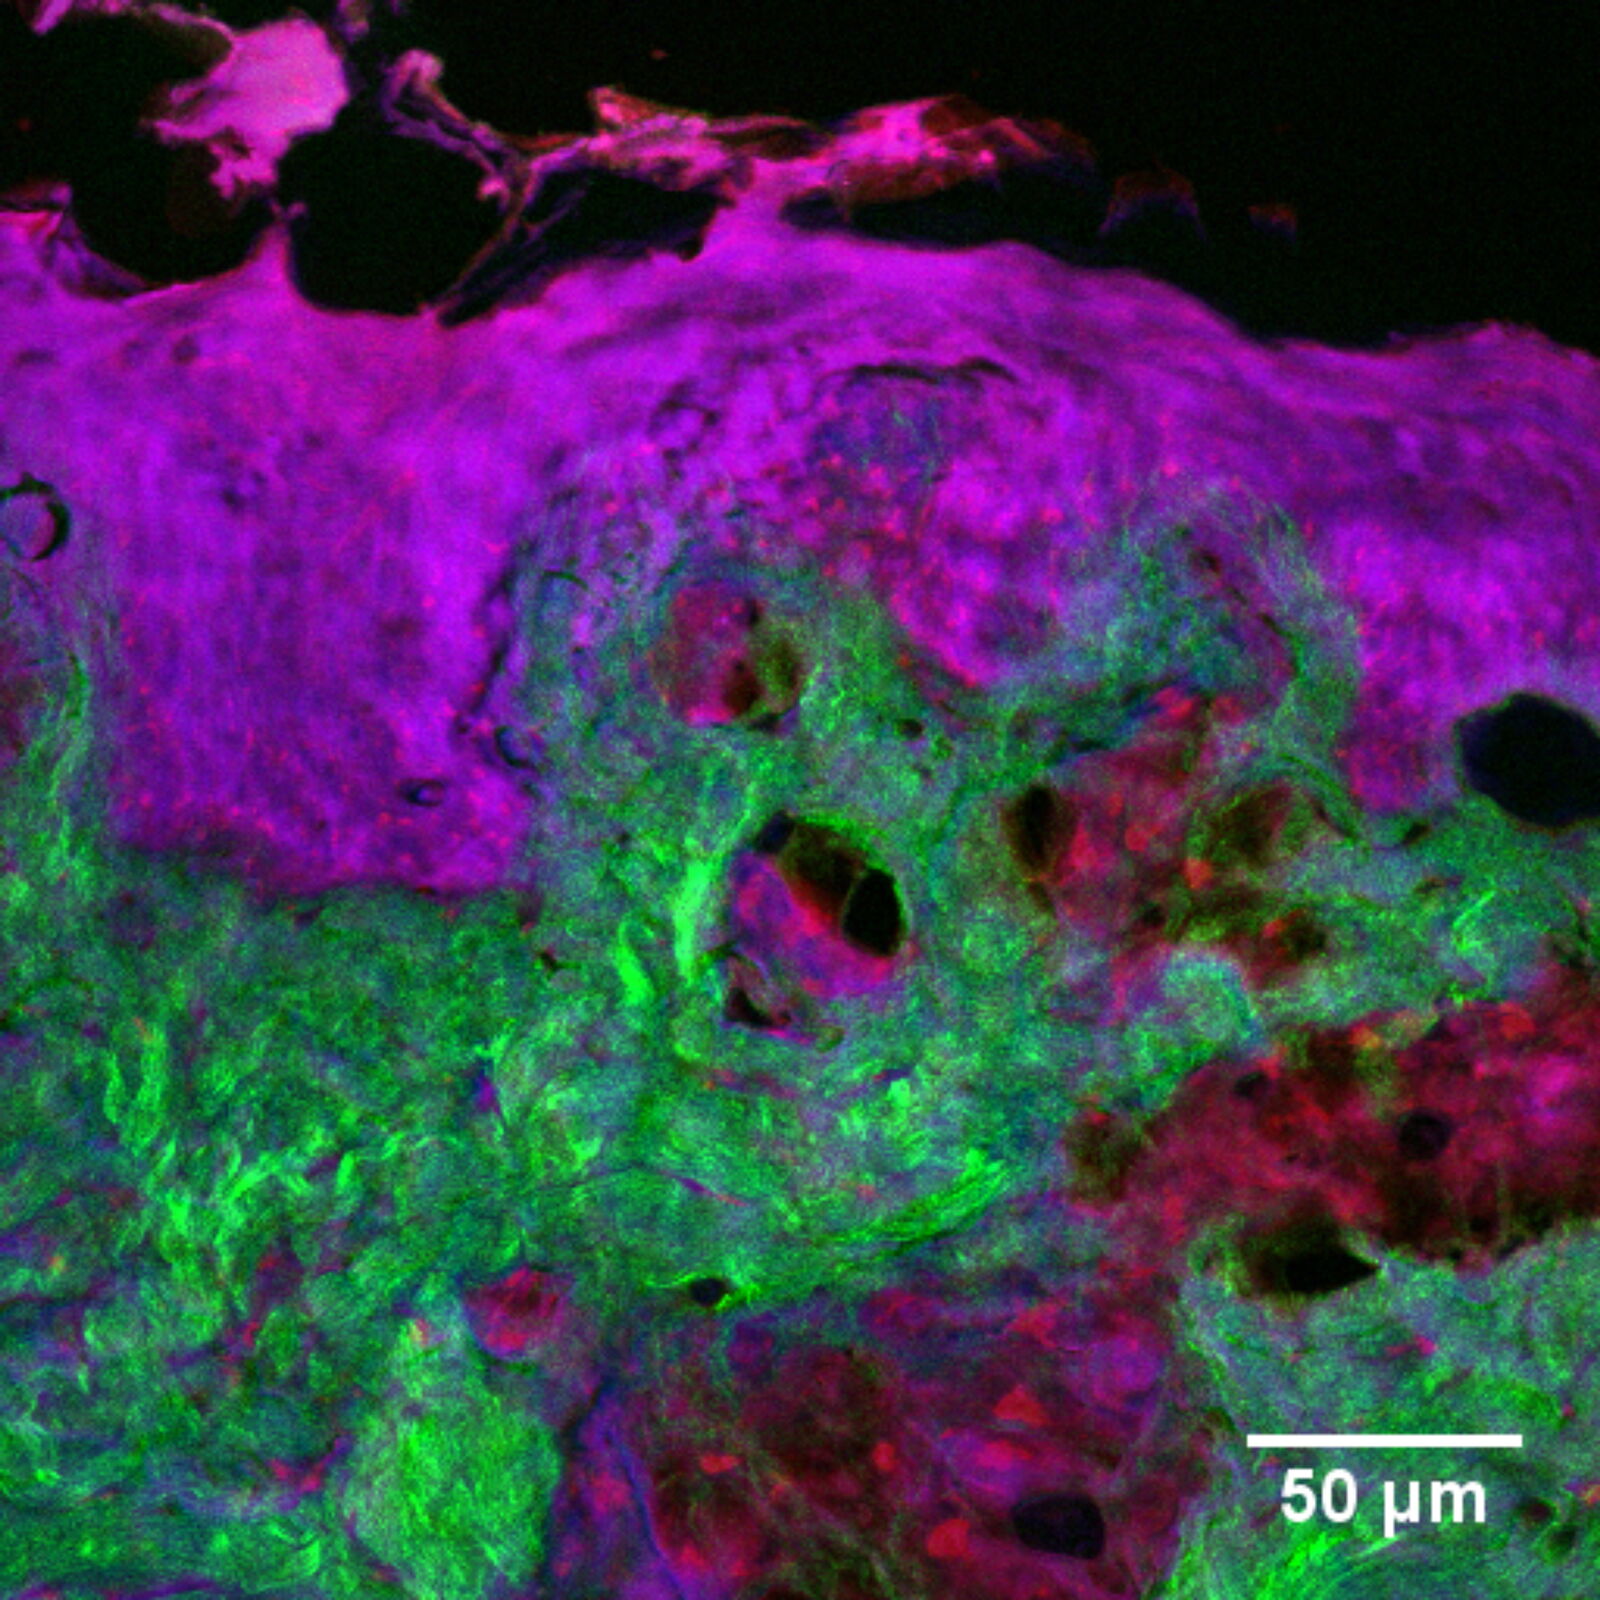
In addition to characterizing the formulation itself, SRS is also an excellent tool with which to visualize fate of individual ingredients post-application. For example, monitoring chemical permeation into the skin has extremely important applications in drug delivery and chemical risk assessment. Figure 4 presents an image of skin dosed with 4-cyanophenol. The tissue was cryo-sectioned and imaged with SRS to reveal the distribution of this compound using contrast for the nitrile functional group at 2235 cm-1 (magenta). The skin structure was visualized using the CH2 stretching vibrational mode at 2850 cm-1 (red); the amide I at 1666 cm-1 (blue); and the collagen distribution using the SHG channel (green).
Since the SRS signal is linear with concentration, it is possible to extract some degree of quantitative information through image analysis, for example, relative concentration of a chemical species with skin depth. For physical cross-sections imaged in the same confocal plane this is reasonably straightforward. However, when imaging 3D specimens, corrections must be made for signal losses due to laser light scattering and absorption with increasing depth.
When trying to image chemical species that do not contain unique chemical functional groups distinctive from the tissue, it can sometimes be challenging to obtain specific contrast. In such instances, deuteration of a molecule of interest can help by shifting the peak to the biological ‘silent’ region of the Raman spectrum where there is little to no signal naturally present in the tissue. This approach can provide a convenient tool to allow sensitive and chemically specific visualization without introduction of a fluorophore which would perturb the physicochemical properties and hence the pharmacokinetics. Alternatively, multivariate data analysis methods can be employed to perform spectral unmixing of the different components.
Acknowledgements
Support of the ‘Analytical Chemistry Trust Fund’ and ‘Community for Analytical Measurement Science’ are gratefully acknowledged.
* Data acquired in collaboration with the group of Prof. Richard Guy, University of Bath, UK. Funding for this research was made possible, in part, by the Food and Drug Administration through grant (1U01FD006533-01). Views do not necessarily reflect the official policies of the Department of Health and Human Services; nor does any mention of trade names, commercial practices, or organization imply endorsement by the United States Government.
 dataset, showing the biochemically distinct structures of a fresh, untreated apple slice.")
, unsaturated lipids (magenta, 3050 cm-1), collagen (SHG, cyan). Sample courtesy of R. Rudolf, J Klicks, Hochschule Mannheim")