Spectral dispersion
The spectral separation of the emitted light from the sample occurs in two steps. The first step is the dispersion of the emitted light spatially into a spectrum, like in a classical spectrometer (1). A prism (Fig 1) is chosen as it is much more efficient in terms of transmission compared to gratings (2).
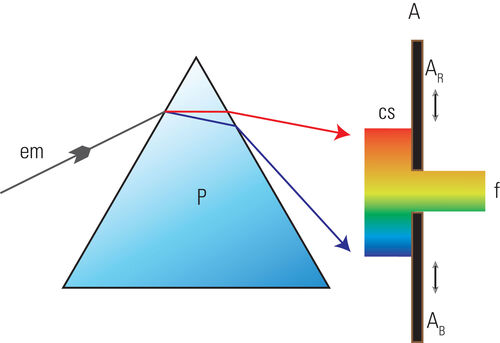
Figure 1 shows the principle of a prism spectrometer, here explained by a simple prism based on a triangle. The SP-Detector employs a prism with a special geometry, a “Pellin-Broca-Prism” (3). This geometry ensures minimal losses, simplifies adjustments, and enhances mechanical stability of the whole setup.
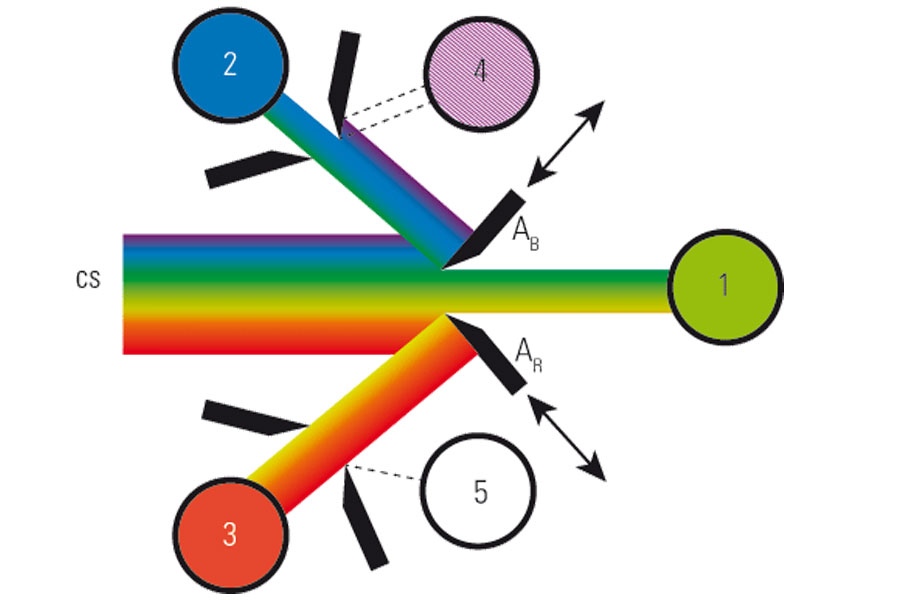
In a classical slit-spectrometer, the desired fraction of the color spectrum is selected by a pair of blackened barriers that are individually movable and, therefore, allow any desired band to be selected from the whole spectrum.
Separation of spectral bands
The second step in the SP-detector applies the slit concept with modifications. Instead of blackened metal, the barriers are coated with a highly reflective layer on the incident side (4).
They are also arranged in an angle. The hereby reflected light can then enter a further arrangement of mirror sliders and sensors. Cascading such arrangements allows the entire spectrum to be split up into a series of spectral bands. The center frequency and bandwidth of each band are continuously tunable.

The arrangement of prism and mirror-slit cascaded sensors is virtually polarization-independent and highly transparent. Therefore, it features a very high photon efficiency which is needed to collect as much as possible of the precious fluorescence photons by applying illumination with as low an intensity as possible.
Individual gain
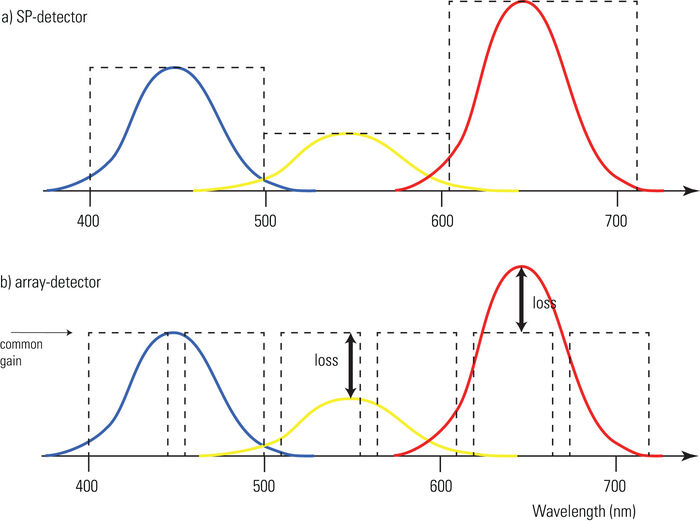
The number of sensors may be chosen according to needs of the application. They can be classical photomultiplier tubes (PMT) or Hybrid Detectors (HyD) that come with a highly efficient GaAsP-photocathode. As the gain of each sensor is controlled independently, the dynamic range in each channel can be adapted appropriately (see fig 3) to enhance the S/N ratio. That capability is an advance compared to array-detectors that operate with only one single gain setting. Numerical adjustments offered with array detectors as a means to adapt a number of channels to various intensity ranges do not improve the signal quality.
Performance of individual point detectors and array detectors
Individual spectral band and detector settings like in the SP-detector allow the sensing performance for each fluorescence channel to be fine-tuned individually (5). That function ensures the best signal/noise ratio for all fluorescence channels and allows illumination at the lowest intensity possible.
See reference 5 for a more detailed discussion.
 and phalloidin (magenta), imaged using Viventis SCAPE; scale bar 50μm. Courtesy of Marina Cuenca and Heleen Jungen (Dayton lab), EMBL Barcelona.")
 and acceptor (A) molecule which participate in FRET (Förster resonance energy transfer).")