The Hybrid Detector (HyD) is a chimera of both technologies. It dexterously combines these two concepts and maintains the beneficial features of both:
- short and equal pulses
- extremely low noise, and
- a large dynamic range.
Types of sensors
A true confocal scanning microscope focuses the light for illumination into a single spot. In order to generate a two-dimensional image, this spot must be scanned in x and y directions over the sample. Although the scanning machinery requires some efforts in design and manufacturing, the sensor can be a single device, as compared to widefield camera chips, that must provide as many sensor elements in parallel with picture elements (pixels) that are requested. As no xy-readout electronics are needed, single-spot sensors feature better signal to noise ratio as compared to array-detectors.
Photomultiplier tubes (PMT)
Probably the best-known sensor for confocal imaging so far, is the classical PMT (Fig 01), which started its career more than 80 years ago in the early 1930’s[1]. It is based on the photoelectric effect, first described by H. Hertz[2] and interpreted by A. Einstein[3]. A photo cathode, usually a layer of alkali-atoms that can release electrons readily upon absorption of a photon, is exposed to the source of radiation (here, the light is focused onto the photocathode). Best performance in terms of quantum efficiency in the visible range is achieved with Gallium arsenide phosphide cathodes (GaAsP). A voltage accelerates the photoelectron to the first dynode, where secondary electrons are released. The gain at the dynodes is typically limited to less than fivefold, due to the properties of the dynode material. The electric pulse generated by a single dynode could not be distinguished from the electrical noise. To achieve sufficient gain, the secondary electrons are accelerated to the next dynode and so forth[4]. This procedure allows gains up to circa 108 or even more, which is sufficient to pick up a measurable electrical current.

Photomultiplier tubes feature a very wide dynamic range, i.e. they can be used for very low photon densities and comparably high intensities.
Avalanche photodiodes (APD)
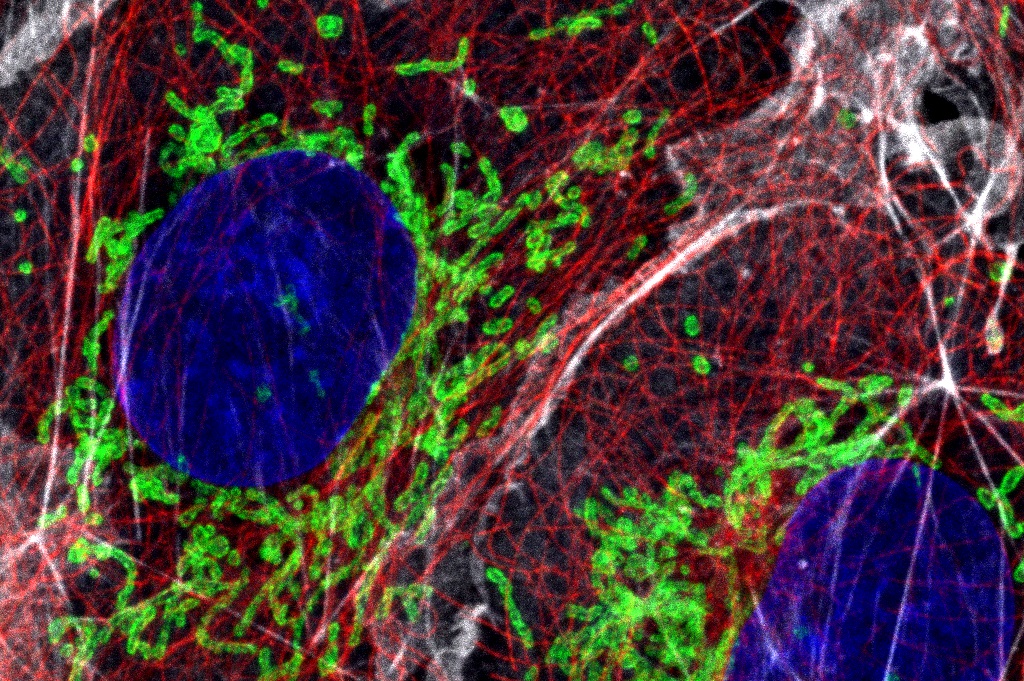
A semiconductor counterpart to the vacuum PMT was brought to the market with the invention of an APD, which is a derivative of the PIN diode. A PIN diode features an additional sparsely doped layer between the p-type and n-type layers. The APD is a modified PIN diode, complemented by a multiplication layer (Fig 02). If a photon is absorbed in the intrinsic layer, it will generate a charge pair (inner photoelectric effect), the charge is then accelerated by the applied voltage. The strong electrical field in the multiplication zone (p-n, in Fig 02) causes an amplification by releasing many (up to circa 1000) additional charges. The output signal is proportional to the number of photons absorbed, therefore, the device can be used as a light sensor over a certain range of intensity. At higher voltages, the absorption of a photon causes a breakdown accompanied by very high gain (up to 108, “Geiger mode”), which is typically used for single-photon detection. As a continuous breakdown would destroy the device, this mode is only suitable for sufficiently low light intensities.
APDs have been successfully employed for single photon measurements, especially in FLIM (Fluorescence Lifetime Imaging) and FCS (Fluorescence Correlation Spectroscopy) experiments. However, they are rarely used for confocal image recording.
Hybrid detector (HyD, HPD)
The PMT’s main limitation is the low gain at each multiplication step. The APD’s main limitation is its range of operation: only very low intensities (in Geiger mode). A hybrid combination of the two technologies offers a solution that fortunately shows the beneficial features of both. This combination of vacuum and semiconductor technology was originally developed for experiments in particle physics [5].

A hybrid detector uses a photocathode, like a PMT, and also GaAsP for best performance. The photoelectron is accelerated by a high voltage of circa 8000 Volts in a single step. The high-energy photoelectron hits a semiconductor target, where the kinetic energy is dissipated, and is converted into separated charges (electron-hole pairs). The gain in this step is already circa 1500. The following multiplication layer (see avalanche diode) boosts the signal again by a factor of about 100 times. Now it is sufficient to pick up a measurable signal at the anode. The signal is a series of electrical pulses, where each pulse is correlated to one photon arriving at the cathode.
Parameters
Although the three classes of sensors all convert photons into electrical signals, they perform quite differently. To find out which sensor is best for confocal imaging, we will briefly look at three important parameters:
- noise,
- pulse-uniformity, and
- pulse-width.
The latter two are of high importance if we want to use photon counting instead of analog integration[6]. Photon counting is much more precise and gives a direct ratio of pixel information to sample brightness.
Noise
Among the various sources of noise, the dark noise has a serious impact on the quality of low intensity images. Dark noise in our context denotes a signal at the anode (electric pulses) without a photon being absorbed by the cathode. It is essentially ruled by the temperature of the sensitive components and their size. A photocathode, for example, will itself emit electrons in absolute darkness, if the temperature is high enough to cause the occasional release of an electron from the cathode material. This electron is accelerated by the applied voltage and causes a pulse at the anode which looks like a photon-pulse. Also, the dynodes may emit thermal electrons, where the first dynodes cause higher pulses than dynodes closer to the anode. From that, we can already conclude, that thermal electrons from dynodes is a problem only related to PMTs: HyDs and APD have no dynodes. The counterpart of thermal electron occurrence for photocathodes and dynodes is thermal charge separation for semiconductor material. The overall dark noise is composed of electrons from all possible contributors. If very low dark noise is required, the sensors will benefit from cooling: upon lowering the temperature by circa 5 K, the dark noise is halved (material dependent). Applications for extremely low intensities use even liquid nitrogen cooling to essentially eliminate dark noise.
Classical PMTs with cathode sizes of some 50 mm2, plus the additional dynode area, have a quite high dark noise (see Tab 01) which prevents their use in applications with very low photon density. For live sample experiments, the goal is to use as dim an illumination light as possible, in order not to ruin the sample by phototoxic reactions. Unfortunately, that requirement will multiply the noise problem. APDs and HyDs have no dynodes. For these devices, the dark noise is mainly controlled by the active area of the sensor. The active area of an APD is typically some 0.05 mm2, i.e. very small, requiring additional means and effort to focus the light stably onto the target. Keep in mind: the confocal microscope uses not a fixed, but rather a scanning beam. Add to that the multiple options for optical parts and the demand for precise alignment increases even more. HyDs have an active area of circa 7 mm2, small enough to suppress dark noise[7] and large enough to ensure full pickup of the optical signal, even under strained conditions.
Pulse height distribution
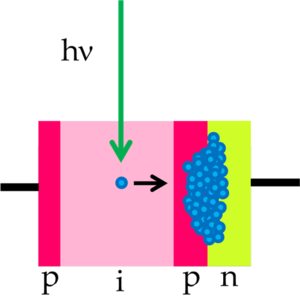
Ideally, the output pulse for any photoelectron released from the cathode would look exactly the same. Although, practically speaking, this assumption is far from real, especially for PMTs as we will see below. Not only is the pulse width and the time between photon absorption and output pulse peak (called “transit time”) varying, but also the height of the pulses. Pulse-height variations directly cause variations (noise) of signals that are recorded by integrating the anode current. In the case of photon counting, variations in pulse height may cause count losses if the pulse cannot be distinguished from the electronic noise of the amplification circuits (see Tab 01 and Fig 4, event #2 in the PMT case is equivalent to events #3 and #4 in the HyD case).
The height of the output pulse is essentially ruled by the gain of the first amplification step[8]. For a PMT, that is the gain at the first dynode. As mentioned above, that gain is limited by the dynode material and falls somewhere in the range of 2 to 8. The variation is governed by Poisson statistics, e.g., if we assume an average gain of 4, the variation is +/- 2, meaning there is a good chance to get from 2 to 6 electrons in the next event. The pulse height is then varying by roughly a factor of three. The gain of the later dynodes has the same statistical behavior, but as the number of electrons is growing from dynode to dynode, the variations are averaged and contribute less significantly to the noise.
The situation is entirely different in a HyD, where the gain in the first step is 1500. The variation of the gain is proportional to its square root (Poisson statistics), therefore, the peak variation varies by less than 3 percent which is 100 times better than that of the PMT case. Especially photon counting with a HyD is much more precise, due to uniform pulse heights. As already mentioned, photon counting is the gold standard for intensity measurements.
Pulse width
Photon counting is done by counting the pulses at the sensor’s output. A brighter intensity correlates with more pulses per time. If the intensity surpasses a certain level, the pulses start “melting” together and individual events cannot be separated (see Fig 04 and Tab 01). This light intensity level is obviously strongly correlated with the width of the electrical pulses: the finer the pulses are, the higher the intensity that can be used for imaging. PMTs that normally are used in confocal imaging generate quite long pulses, in the range of some 20 ns. Light intensity is the amount of photons per unit time detected in a given picture element. In the photon-counting mode, the intensity is described as “counts per second”. If the photons would arrive in identical intervals of just 20 ns, one second would hold 50 million counts (50 megacounts per second - 50 Mcps). But photons are emitted from the sample in a stochastic manner, the maximally allowed pulse is therefore only about 15 Mcps. A standard fluorescence sample would deliver some 100 Mcps in a confocal volume, so its signal is not measurable with a PMT in photon counting mode. APDs are limited in dynamic range due to the long dead time the sensor needs for regeneration after each pulse. Photons that arrive during the pulse duration and dead time are lost. Only very low intensities can be quantified accurately with APDs.
A HyD shows pulses of circa 1 ns. The SP8 platform with HyDs can operate at up to 300 Mcps and, therefore, is suitable for standard fluorescence confocal imaging. Its dynamic range covers very low light intensities and the standard fluorescence stained samples used for confocal imaging.
Summary
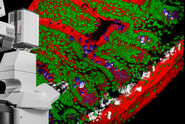
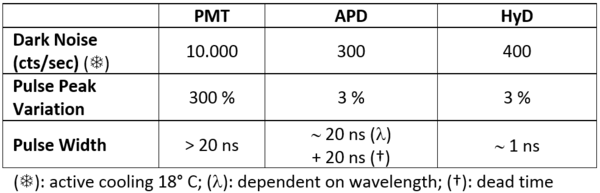
Hybrid detectors (HyDs) show very low noise compared to photomultiplier tubes (PMTs), as shown in the first line of Tab 01. The dark noise level is comparable to that of an avalanche photodiode (APD). Also, the pulses are very uniform, which make them ideal devices for photon counting – similar to APDs, as seen in line two of Tab 01. The differentiator between PMTs and APDs is the very short pulse width with no delay time (line three in Tab 01). That difference allows HyDs to be used for the detection of intensities typically found with fluorescence samples, whereas an APD would be long since saturated. The HyD produces crisp fluorescence images with a truly black background, both for low intensity situations (like high speed live imaging) and standard fluorescence samples.
The HyDs are equipped with Gallium-Arsenide-Phosphide (GaAsP) cathodes. The HyD quantum efficiency is identical to GaAsP PMTs. Still, the HyD photon detection efficiency is even better than that of PMTs, due to the short and straight trajectory of the photoelectrons.
By the way, HyDs are also ideal sensors for special applications, like fluorescence lifetime imaging (FLIM) and fluorescence correlation spectroscopy ( FCS ), as they show very narrow transit time variations and, essentially, no after pulsing (for details see ref 7). That makes a HyD the champion of sensors for any beam-scanning based microscope.