Introduction
Optimal ways to analyze the quality of steel, whether low carbon, stainless, or high alloyed, are described. The analysis concerns the characterization of non-metallic inclusions present in steel in accordance with the requirements of various international and regional standards, such as EN 10247, ASTM E45, ISO 4967, DIN 50602 (replaced by EN 102047), SS 111116, etc.
The quality of steel is essential for industries like automotive, transportation, metalworking, electric power, and construction.
To ensure the highest standards, an accurate and reliable quality assurance workflow for the inspection of non-metallic inclusions is critical. These 3 main points are important for the optimization of incluson detection and analysis during steel production:
- Standards and analysis methods which fit best to the inspection techniques used and types of steel produced;
- Improved sample preparation prior to inspection to yield better analysis results; and
- Flexible workflows via the use of manual or automated microscope solutions with both live and off-line analysis capabilities.
Leica Microsystems offers state-of-the-art and customizable microscopy solutions, using the LAS X Steel Expert software, for inspecting the microstructure and evaluating the non-metallic inclusion content of steel. They range from manual inspection to fully motorized solutions, whichever is optimal for the necessary workload.
Rate the quality of your steel - Webinar
Advantages of using the LAS X Steel Expert software for non-metallic inclusion analysis to rate the quality of steel.

Why Evaluate Non-Metallic Inclusions in Steel?
Present-day methods of steel production are unable to attain an alloy free of non-metallic inclusions. So inclusions are present in all steels to a greater or lesser extent depending on the raw materials and production methods used. The quality of steel is influenced by its composition and the melting and processing methods, but also by the properties (size, shape, hardness, and chemical composition) of non-metallic inclusions present within it. There can be a large variation in the properties of steel inclusions even within the same production batch. For this reason, different analysis methods for inclusions have been developed and are now commonly in use. These methods make it possible to determine accurately the composition, structure, and amount of non-metallic inclusions in steel.
Non-metallic inclusions are foreign substances in steel which can have a very complex appearance (refer to figure 1 and 2). Their presence disrupts the homogeneity of the steel microstructure and, as a result, they can have considerable influence on the steel’s mechanical properties. During production, deformation often occurs from rolling, forging or stamping. It has been shown that deformation of steel with non-metallic inclusions can induce cracks and fatigue failure.
Traditionally, inclusions are categorized by composition, but also their origin as either endogenous or exogenous. Endogenous inclusions form in steel when trace amounts of non-metallic elements, mainly nitrogen (N), oxygen (O), phosphorous (P), and sulfur (S), are present. The majority of inclusions in steels are oxides and sulfides. Usually, the amount of phosphorus is quite small, so phosphide inclusions are seldom. The composition of oxide inclusions covers a very wide range of binary, ternary and even quaternary compounds which are complex mixtures based mainly on aluminum oxides (alumina or aluminates) or silicon oxides (silica or silicates). Exogenous inclusions are caused by the entrapment of external contaminants and their source can include slag, dross, flux residues, and pieces from molding materials. Their presence and size is highly variable and their detection is normally carried out by in-line or non-destructive methods like ultrasonic testing.
“Cleanliness” of Steel: Amount and Type of Inclusions
Although the term “cleanliness” is not very appropriate to describe the level of non-metallic inclusions in steel, it is still widely used in the steel industry. Cleanliness indicates the steel has been processed by different techniques to reduce the amount of inclusions and their associated risks.
Another term often used is “clean steel” which describes a steel product with not only a low level of oxide and sulfide inclusions, but also other non-metallic elements like nitrogen (N), phosphorus (P), and even hydrogen (H) (refer to table 1).
Element | Typical Steel Product | Content (1 ppm = 0.0001% wt) |
H | Rail | < 1.5 ppm (0.00015% wt) |
O | Wire Cord | < 10 ppm (0.001% wt) |
S | Gas Pipes | < 10 ppm (0.001% wt) |
N | Electric Sheet | < 20 ppm (0.002% wt) |
P | Offshore Structures | < 80 ppm (0.008% wt) |
Table 1: Composition of “clean steel” in terms of the elements O, S, N, and P which non-metallic inclusions tend to be composed of, as well as, H which can cause embrittlement. Clean steel exhibits a maximum of 60 parts per million (ppm) (0.006% wt) for these elements combined and ultraclean steel a maximum of 30 ppm (0.003% wt).
Hydrogen does not form inclusions, but can lead to embrittlement from its diffusion into the metal matrix and eventually premature fracture. It is particularly a problem for high-strength steels.The presence of aluminates may result in poor fatigue properties, while silicates are detrimental if the steel has to undergo heat treatment at a later stage.
Usually the amount of non-metallic inclusions in steel is less than 0.1%. However, the number of inclusions is still very high because of their very small size. For instance, in 1 kg of a standard quality, aluminum killed, low carbon steel there are 0.1 to 1 billion (109) non-metallic inclusions. In terms of size, there are approximately:
- 400 inclusions with a length from 80 to 130 μm;
- 10 with a length between 130 and 200 μm; and
- 1 with a length greater than 200 μm.
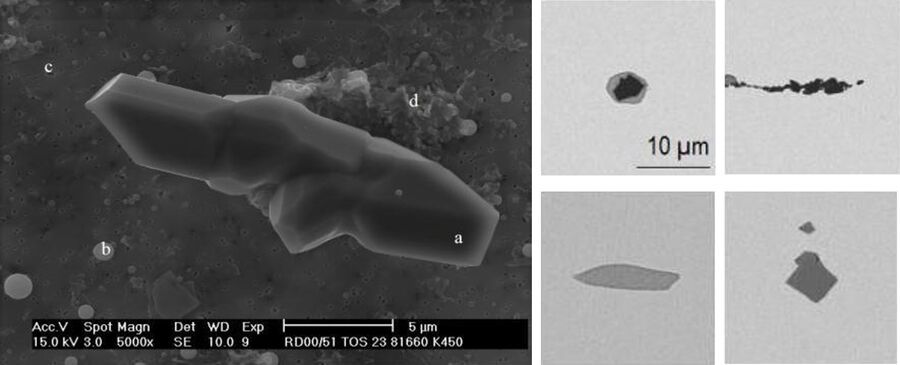
In addition to sulfides and oxides, nitrides are present in special steels that contain elements with a high affinity to nitrogen (N), like titanium (Ti). Titanium is a less expensive alloying element and is increasingly used to refine grain size and improve mechanical properties of steel alloys. As a result, titanium nitride inclusions in steel are ever more common (refer to figure 3). The most recent standard, EN 10247 (see section just below), incorporates titanium nitride inclusions in the rating method.
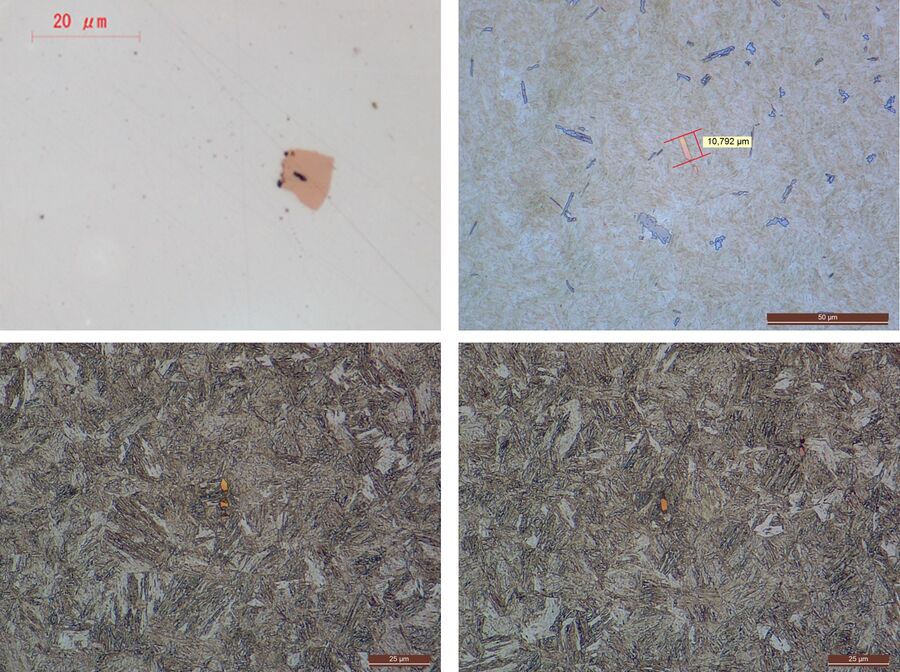
inclusions which can be isolated or grouped together.
The required steel quality depends on the type of application for which it is used. Non-metalic inclusions certainly have an effect on the quality of steel, but some types have more of an effect than others. As an example, for the most common bearing steel, the AISI 52100 alloy, a previous study [2] shows the “harmful index” and the ability of different inclusions to increase material stress in relation to their average diameter. As expected, there is a clear correlation between the “harmful index” and inclusion size, but the titanium nitride inclusions show a higher harmful index relative to others of equivalent size.
International and Regional Standards for Inclusion Analysis
Historical Develoment
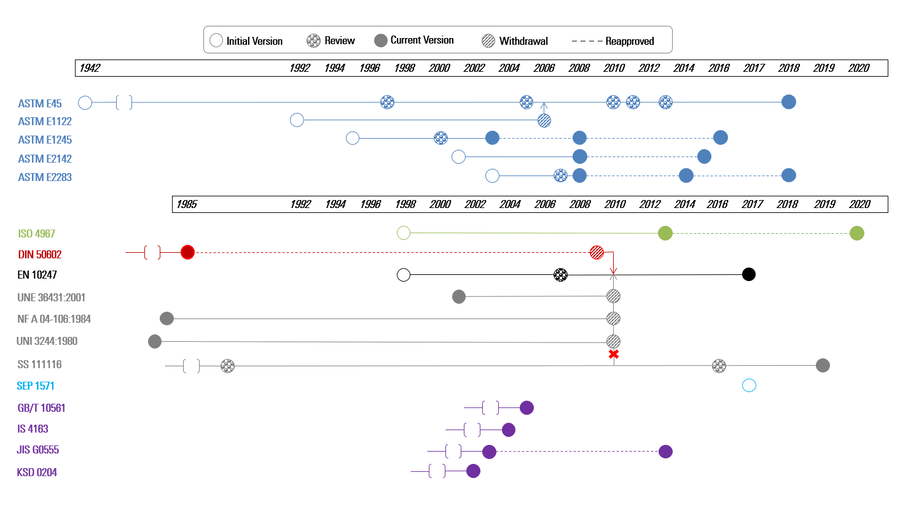
The first systematic rating of inclusions in steel was developed in Sweden by the Swedish Ironmasters’ Association called Jernkontoret (literally Iron Office). It has become known as the JK inclusion rating system, derived from the association’s name [3]. The chart below (figure 4) depicts the chronological development of the standards. In 2006, the ASTM E1122 standard [4] dealing with the JK rating using automatic image analysis methods was merged into and replaced by the general ASTM E45 standard [5]. In 2010, all national standards from European countries, like DIN 50602 [6] and NF A04-106 [7], were officially withdrawn and replaced by EN 10247 [8], except for the Swedish standard, SS 111116, which was re-issued last year with new JK rating charts [9]. It was the first test method eighty years ago and seems still to have much life ahead of it.
Status Quo
Currently, the main international and regional standards which address test methods and practices for the evaluation of non-metallic inclusions in steel are ASTM E45 [5], EN 10247 [8], and ISO 4967 [10] (refer to table 2).
ASTM E45 is the principal test method, but other standards, such as ASTM E1245 [11] and ASTM E2142 [12], are available for particular cases, like determining the inclusion content with stereological methods and inclusion rating using electron microscopes. ASTM E2283 [13] describes a methodology to statistically characterize the distribution of the largest endogenous non-metallic inclusions based on quantitative metallographic measurements. This practice applies a statistical approach to estimate the extreme value distribution of inclusions in steels.
ISO 4967 is equivalent to ASTM E45. DIN 50602 [6] was replaced by EN 10247, but DIN 50602 is still largely used in Europe. In fact, a new version of EN 10247 has been issued at the beginning of the year 2017 with relevant changes to facilitate its adoption by the European steel market.
Finally, there is a group of standards, such as ASTM E768 [14], ISO 3763 [15], ASTM E340 [16], ASTM E381 [17], and ASTM E1180 [18], used for macrostructure evaluation of steel, macroetching, and sulfur prints (refer also to table 2). ASTM E768 provides a guide for preparing and evaluating samples for the assessment of non-metallic inclusions by automatic image analysis methods. ISO 3763 explains inclusion assessment by macroscopic methods.
Overview of Steel Quality Standards
| Steel Quality Characterization Standard | Description of Standard |
Main Standards | EN 10247:2017 [8] | Micrographic examination of the non-metallic inclusion content of steels using standard pictures |
DIN 50602:1985-09 [6] (replaced by EN 10247:2017) | Micrographic examination of the non-metallic inclusion content of steels using standard picture | |
ASTM E45 – 13 [5] | Standard Test Methods for Determining the Inclusion Content of Steel | |
ISO 4967:2013 [10] | Steel -- Determination of content of non-metallic inclusions -- Micrographic method using standard diagrams | |
SS 111116:2016 [9] | Jernkontoret’s inclusion chart II for quantitative assessment of the content of non-metallic inclusions in metals and alloys | |
NF A04-106 October 1984 [7] (replaced by EN 10247:2017) | Iron and Steel - Methods of Determination of the Non Metallic Inclusion Content in Wrought Steels - Part 2: Micrographic Method Using Standards Diagrams | |
Supplementary Standards | ASTM E1245 – 03 (2016) [11] | Standard Practice for Determining the Inclusion or Second-Phase Constituent Content of Metals by Automatic Image Analysis |
ASTM E2142 – 08 (2015) [12] | Standard Test Methods for Rating and Classifying Inclusions in Steel Using the Scanning Electron Microscope | |
ASTM E2283 – 08 (2014) [13] | Standard Practice for Extreme Value Analysis of Nonmetallic Inclusions in Steel and Other Microstructural Features | |
ASTM E768 – 99 (2010) e1 [14] | Standard Guide for Preparing and Evaluating Specimens for Automatic Inclusion Assessment of Steel | |
ISO 3763:1976 [15] | Wrought steels -- Macroscopic methods for assessing the content of non-metallic inclusions | |
ASTM E340 – 15 [16] | Standard Practice for Macroetching Metals and Alloys | |
ASTM E381 – 17 [17] | Standard Method of Macroetch Testing Steel Bars, Billets, Blooms, and Forgings | |
ASTM E1180 – 08 (2014) [18] | Standard Practice for Preparing Sulfur Prints for Macrostructural Evaluation |
Table 2: International and regional standards for characterization of steel quality in terms of non-metallic inclusions
Classifying Inclusions
In the original JK rating system, the inclusions were divided into 4 groups, A, B, C, and D. To assess the type, number, and size of inclusions in the steel, comparisons between reference images for each group and a live microscope image of a steel sample were made. Today, most, but not all, of the modern standards use these same 4 classification groups, A to D.
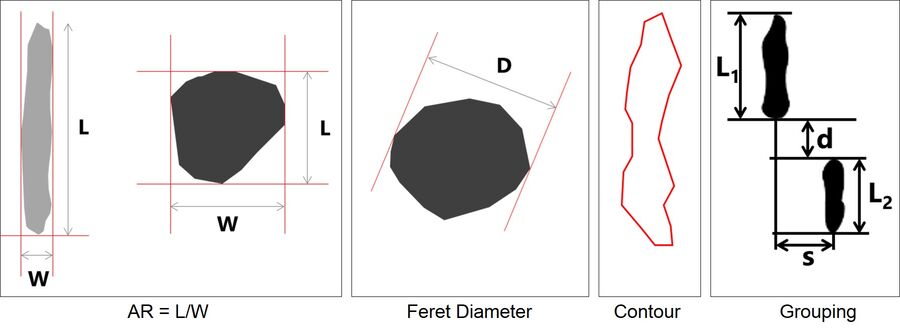
However, for the modern standards, color and morphological parameters are used to define and classify inclusions into these four groups (A to D). Besides length and width for non-round particles and diameter for round ones, other features like aspect ratio, contour, and horizontal and vertical distance between particles are used to differentiate inclusions (refer to figure 5).
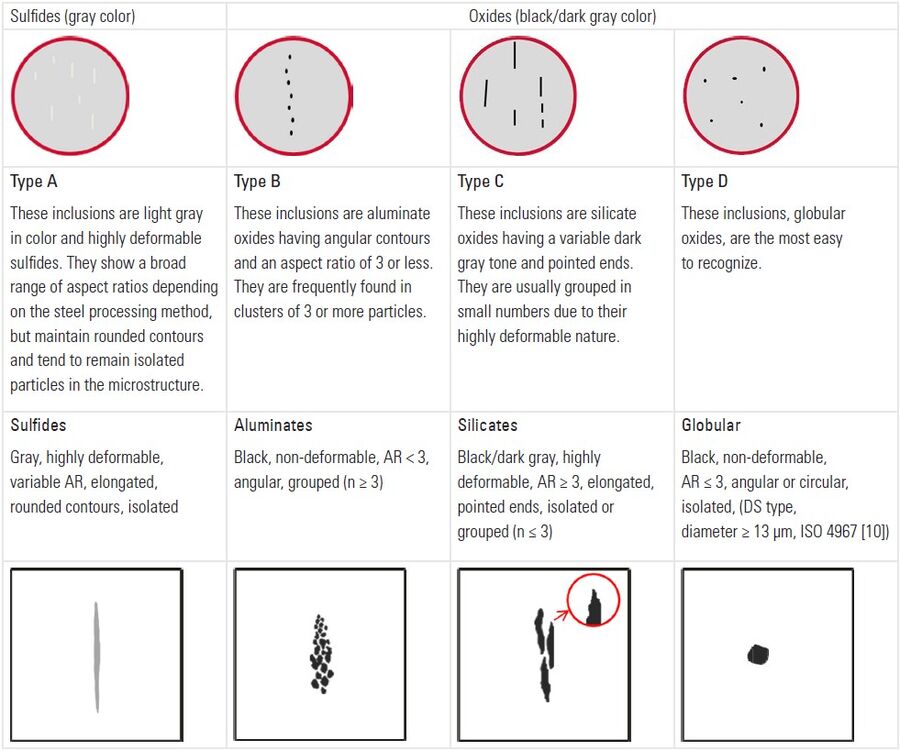
Both ASTM and ISO standards use the Type A to D nomenclature assigned to sulfides, aluminates, silicates, and globular oxides, but each inclusion type is further categorized as thin or thick/heavy according to their width (refer to figure 6). The ISO standard adds a fifth DS type for single globular particles with a diameter greater than 13 μm.
Inclusion Classification with DIN 50602
For classification with DIN 50602 [6], a different nomenclature is used. Elongated sulfide inclusions are labelled “sulfides, streak-like” (abbreviated with SS) and aluminate-type inclusions as “oxides, dispersed” (in German Oxide, Aufgelöst, abbreviated OA). Silicate-type inclusions are referred to as “oxides, streak-like” (abbreviated OS) and globular oxides consequently as “oxides, globular” (abbreviated OG).
This first peculiarity of the DIN 50602 standard arises from the fact that in some steels the degree of deformation is not high enough to fully dissolve aluminate-type inclusions. They will appear similar to elongated, streak-like oxides. Thus, a naming convention without composition bias was selected for the standard.
The size classification of inclusions with respect to inclusion types separates them into a severity level that purely depends on the inclusion surface area. The inclusion area is measured using microscopy. The basic surface area for an inclusion is defined as 100 μm² which corresponds to a size class of 0. The size class is defined by:
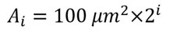
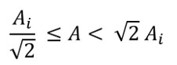
where i is the size class (0, 1, 2, …) and A the inclusion area. So a doubling of the inclusion area corresponds to an increase of the size class by +1. The range for each size class is defined by:
DIN 50602 comparison charts for inclusion rating
As a simplified inclusion area rating per field of view size (microscope) is normally used, no subdivision into thin/fine, heavy/thick, and large single D inclusions is required. However, since humans have trouble to judge areas by eye, in the DIN 50602 a visual aid comparison chart is available. This chart displays the four basic inclusion types with respective examples for the individual size classes. It also introduces 6 additional inclusion subtypes and a rating scheme based on inclusion length.
Based on a typical width per inclusion of a certain class size, additional finer and larger inclusion series are displayed in the comparison chart, leading to a unique, diagonal relationship between inclusion subtypes and main inclusion types (refer to figure 7). The main types are relevant for the size class rating.
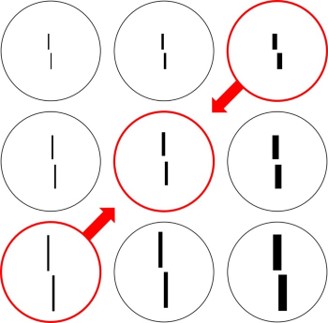
Due to the peculiarity of the main DIN 50602 comparison chart seen in figure 7, when it is used in combination with other comparison charts highlighting different inclusion characteristics, then inadvertently its use for inclusion rating by visual inspection may lead to more confusion than clarity.
Although still widely used on an international basis, the DIN 50602 standard is probably often at least partially misunderstood and frequently misinterpreted.
Classification with the new Standard EN 10247
The new European standard differs substantially from the others as it is not derived from traditional methods, but rather mathematical principles. This approach has some benefits, for instance easier implementation of automated image analysis methods and a comprehensive definition and classification even when doing manual evaluation.
However, one disadvantage is that comparison with results obtained with other standards is difficult. The physical correlation between the standard results and inclusions leads to some controversy that has prevented the rapid adoption and common use of EN 10247 [8] by industry experts.
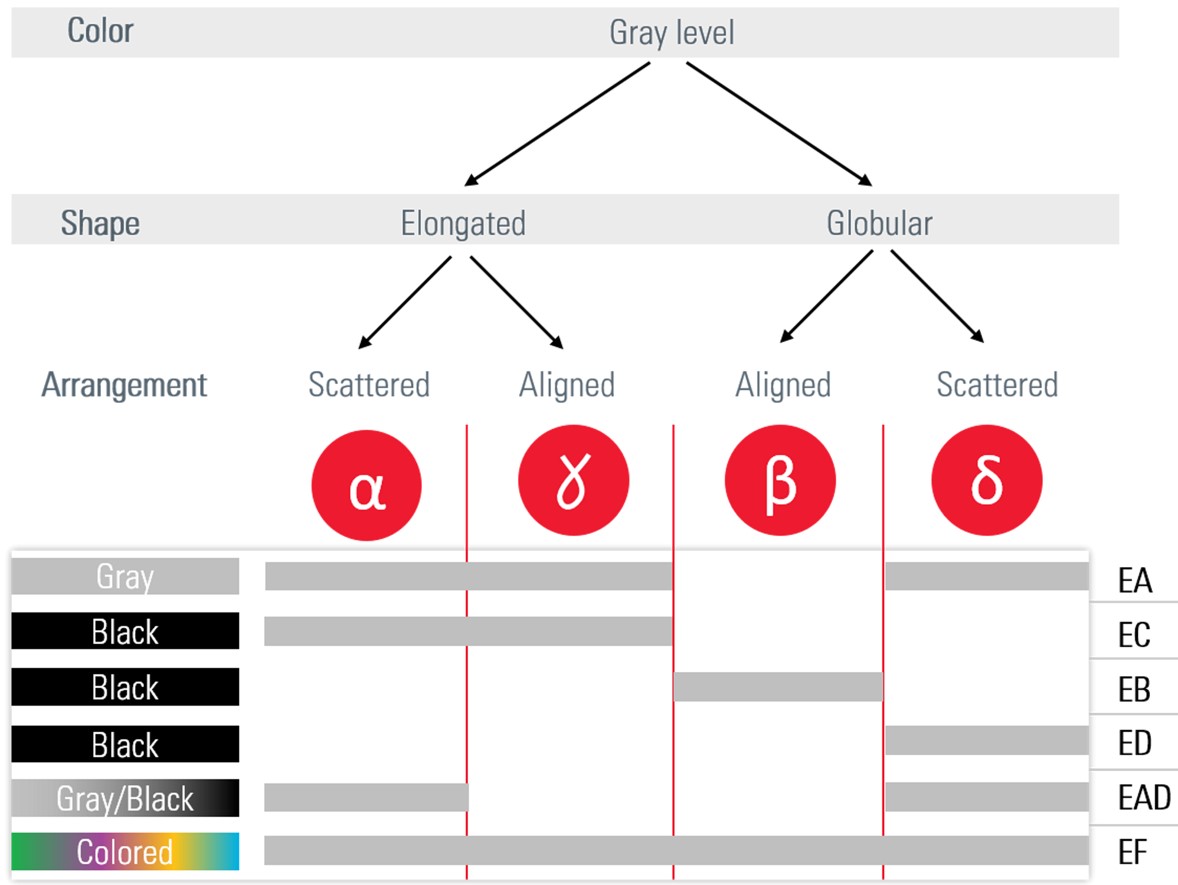
The EN 10247 adds two new groups and modifies the traditional classification method from type A, B, C, and D to type EA, EC, EB, ED, EAD, and EF (see table 3 below).
| Inclision Type | Standard | ||||
ASTM E45 [5] | DIN 50602 [6] | NF A04-106 [7] | SS 111116 [9] | EN 10247 [8] | |
A | SS | A | A | EA | |
B | OA | B | B | EC | |
C | OG | C | C | EB | |
D | OG | D | D | ED | |
– | – | – | – | EAD | |
– | – | – | – | EF | |
Table 3: Types of inclusion as defined by the international or regional standards, ASTM E45, DIN 50602, NF A04-106, SS 111116, and EN 10247.
EN 10247 inclusion categories
The standard EN 10247 classifies inclusions first by color (gray level), then by shape (elongated or globular), and finally by arrangement (scattered or aligned). This sorting of inclusions gives rise to 4 categories: alpha (α), beta (β), delta (δ), and gamma (γ) which are shown in figure 8. Concerning the 2 new inclusion types, EAD represents oxy-sulfides and EF titanium nitrides.
Methods for Rating Inclusions
The methods used to rate inclusions according to the ASTM and ISO standards require a survey of a 160 mm2 (ASTM) or 200 mm2 (ISO) polished (not etched) area of the sample at 100x magnification. The field of view is adjusted to a square of 0.71 mm each side. Flowcharts forthe ASTM/ISO and EN 102417 rating methods used by steel inclusion rating solutions are shown in figure 9 below. A microscope using the LAS X Steel Expert software from Leica Microsystems is one such solution for rating inclusions.
Flowcharts for inclusion rating solutions

Typical Workflow for Inclusion Rating Methods
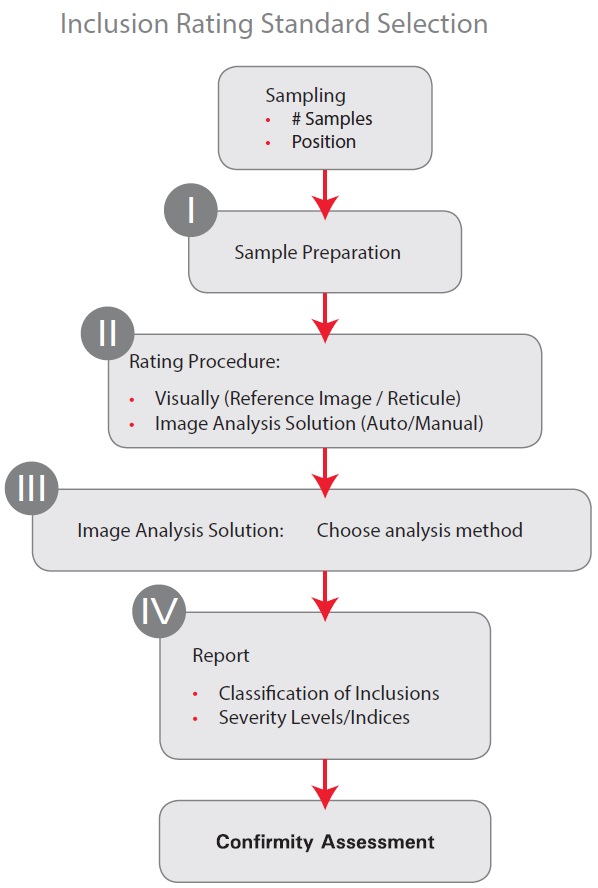
The typical workflow for the rating of inclusions with microscopic methods is shown in figure 10 below. The workflow starts with sampling, i.e., defining the number and positioning of samples to be representative of the batch being tested, followed by metallographic sample preparation. Sample preparation has a great influence on the reproducibility of the analysis and quality of the results, particularly with automated rating solutions. The next step involves selecting the analysis procedure to be done in accordance with a standard method (worst field, worst inclusion, statistical analysis, etc.). Once a method is applied, the results reported should include a classification table with the severity level or index calculated according to the standard. The severity levels/indices are crucial when assessing the steel‘s conformity to user specifications.
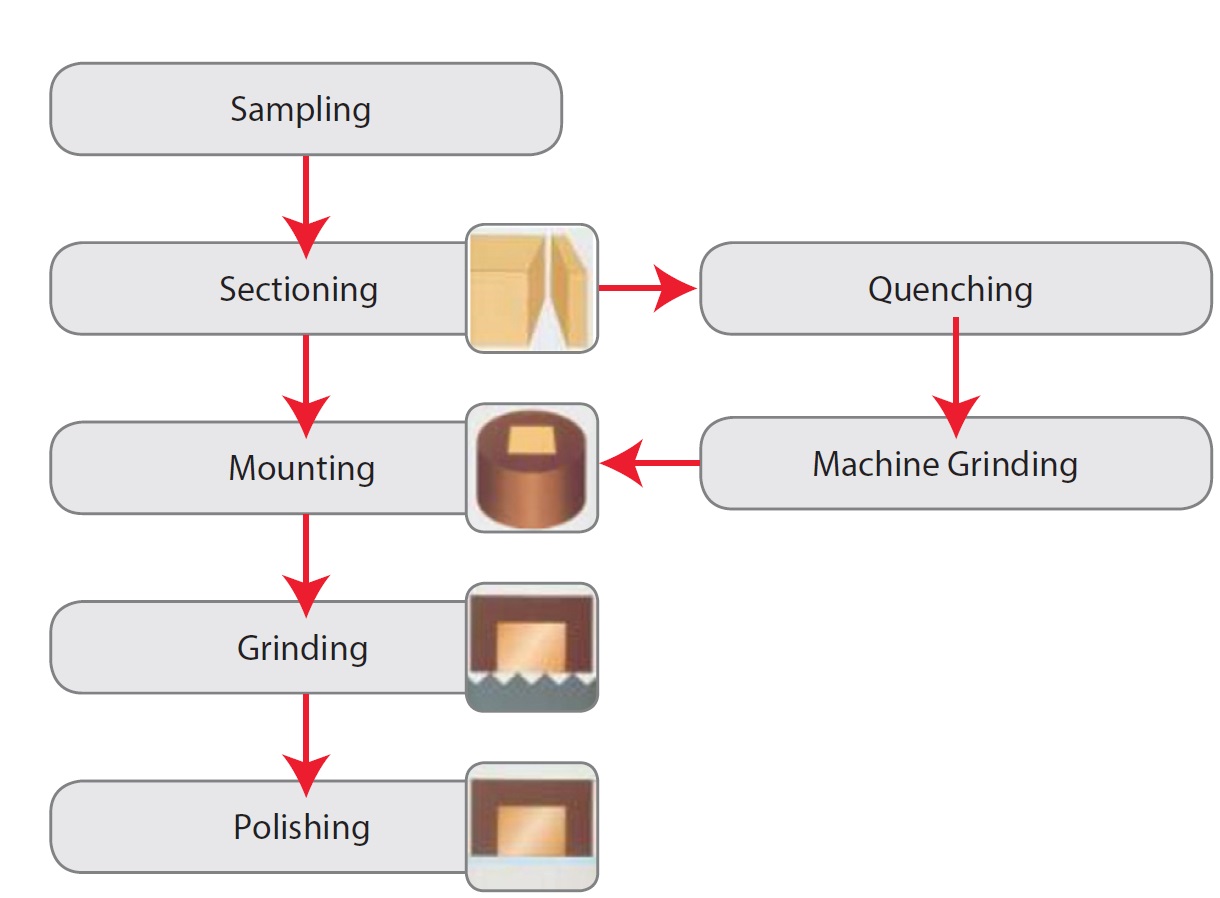
Sample Preparation (Step I in Workflow)
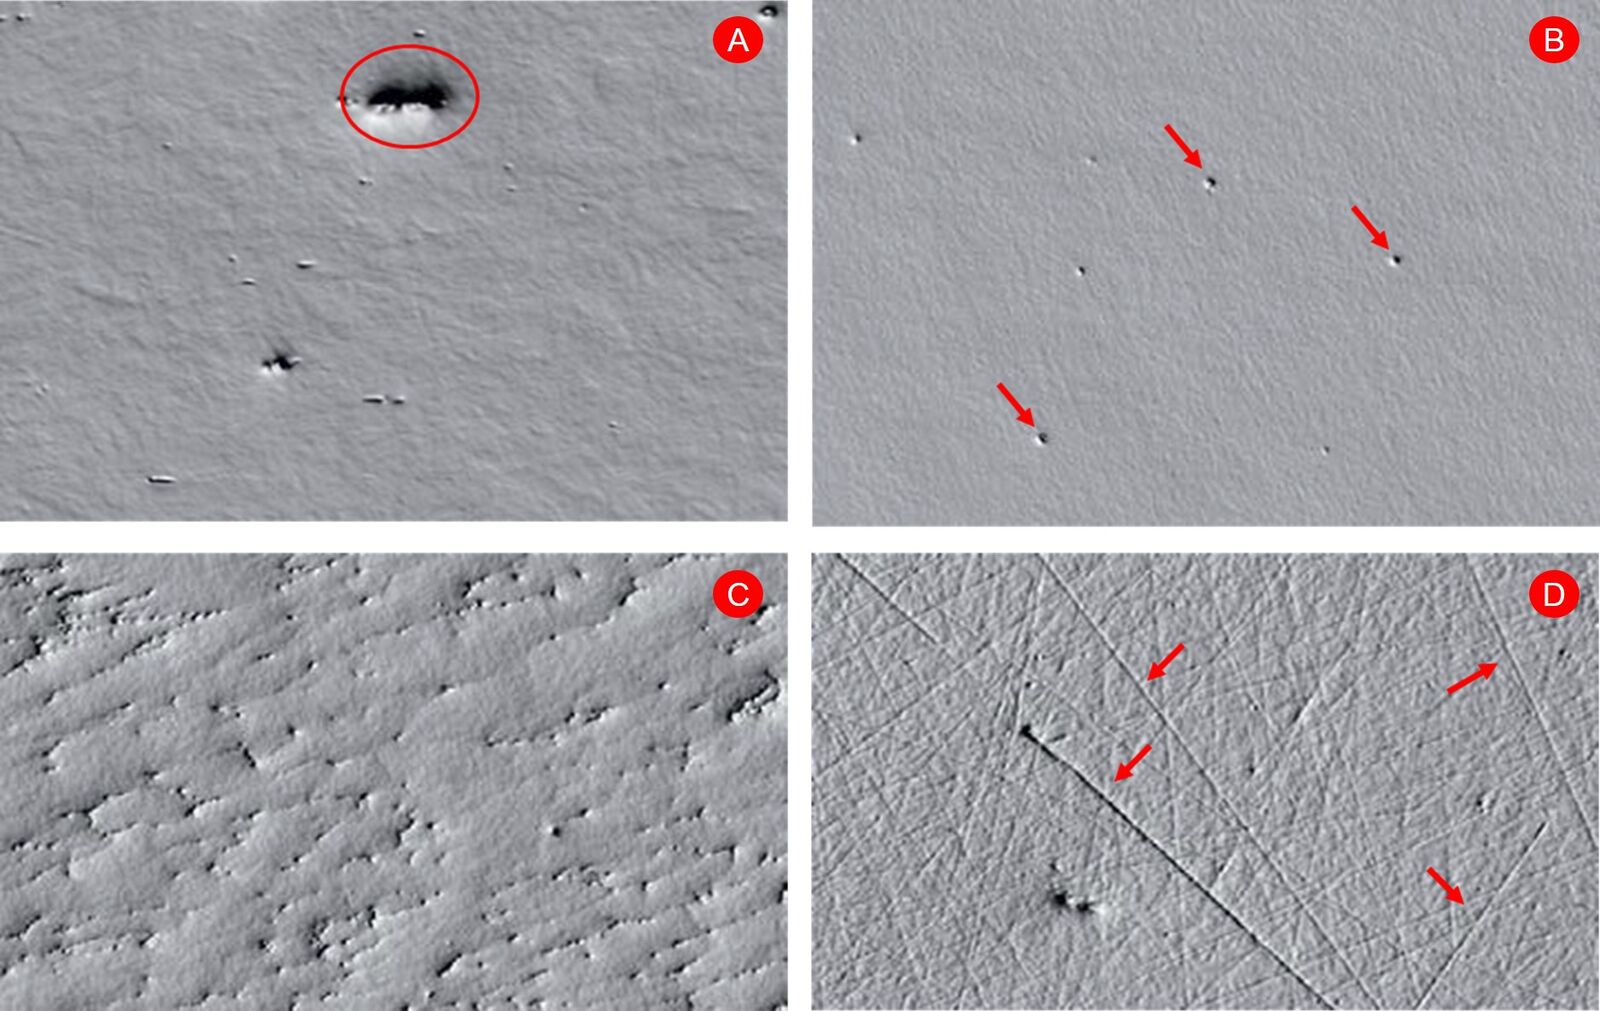
Metallographic sample preparation (refer to figure 11) for non-metallic inclusion analysis can be challenging, because there is no etching at the end and the polishing step should result in a flat surface without scratches and other defects, such as holes or pull-outs, pitting, and comet tails (refer to figure 12). Oxides are harder than the matrix phase and abrade more slowly, while sulfides are softer and abrade more quickly, so after polishing the sample shows the problem of “relief” (figure 12). The risk is a distorted sample shape. In steels without heat treatment, it gives good results to quench and temper the samples to harden the matrix and avoid defects. Machine grinding is recommended after hardening to maintain a surface unaffected by oxidation or decarburization.
analysis to rate the quality.
Preparation defects
Some general recommendations to reduce the number of artifacts from sample preparation are:
- Normally, the final polishing step should be done with a 1 μm diamond paste on a low nap cloth. If pitting of the sample is an issue, then anhydrous suspensions and non-water-based (e.g., alcohol) lubricants should be tried;
- The use of alkaline colloidal silica or acidic colloidal alumina is recommended for soft (not hardened) steels to remove scratches, but this should be carried out with minimum pressure and time to avoid relief and chemical etching of the sample. However, polishing with colloidal silica or alumina is not recommended if electron microscopy analysis will be performed;
- Ultrasonic cleaning is generally not recommended as it can create a halo effect around inclusions due to cavitation;
- In case of problems, it is recommended to follow the rules described in the ASTM E768 [14] standard;
Microscopic Observation of Sample Preparation Quality (Step I in Workflow)
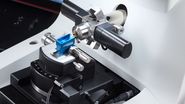
As explained in ASTM E768, a microscope equipped with differential interference contrast (DIC) illumination (refer to figure 13A) and capable of magnification values between 100x and 500x should be used during the sample preparation procedure to verify the true surface appearance. An example would be the DM6 M upright (refer to figure 14) or DMi8 M inverted compound microscope from Leica Microsystems. The results of DIC illumination will improve with the use of a lambda (λ) plate (sensitive tint) [figure 13B].
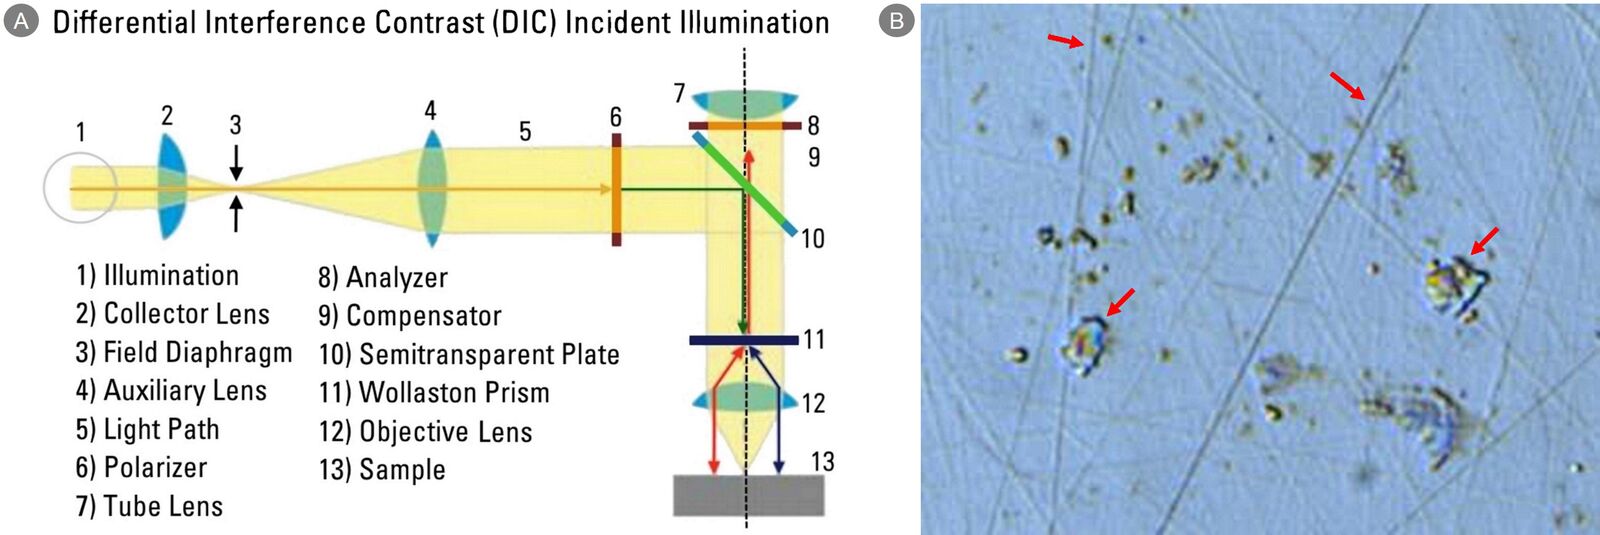
At 500x, narrow bright lines indicating ditches at some inclusion edges could be seen (figure 13B). A method to determine whether these ditches will be detected by the image analysis system involves slowly rotating the polarizer (item 6 in figure 13A) from the extinction position to see if there is any apparent motion of the inclusion edges. If the transition from DIC to brightfield changes these ditches from bright to dark, this result indicates poor sample preparation. The risk of poor sample preparation is that the inclusion could be measured to be larger than its actual size.
Even tiny scratches from final polishing will usually be seen under DIC at 500x. Normally, these scratches vanish upon rotation of the polarizer and will not affect the inclusion rating at lower magnification. In addition, the software will automatically remove most of them as artifacts, even if they are still visible.
Oblique light is also a valid alternative to see height differences, although it cannot give any color information.
Once the sample preparation method is optimized, then the assessment procedure can be selected.
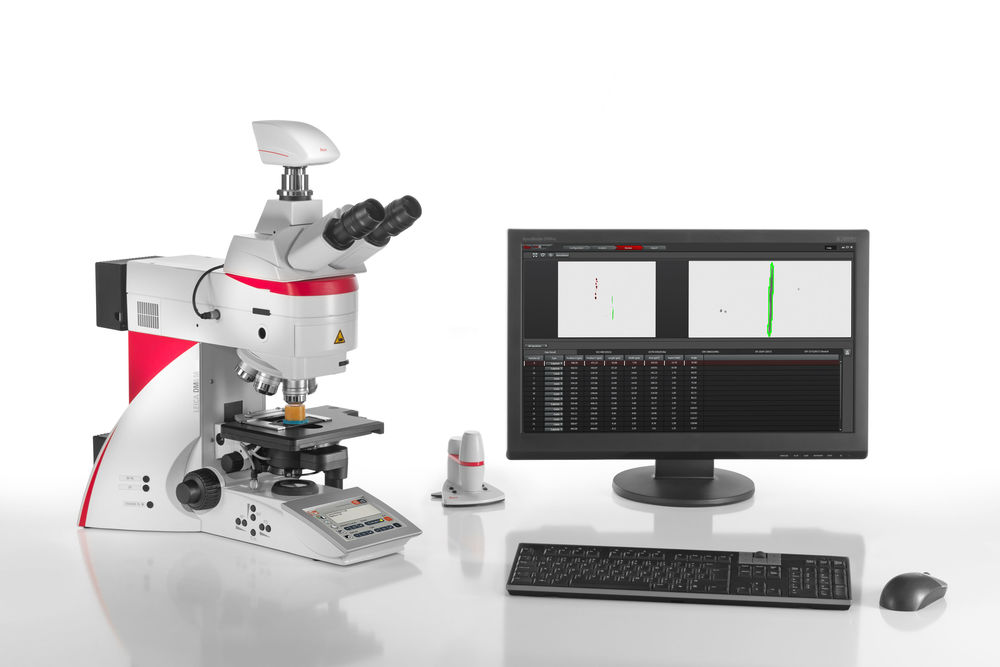
Image Analysis Solutions for Rating Steel Inclusions (Step II and III in Workflow)
LAS X Steel Expert microscope software
The LAS X Steel Expert software from Leica Microsystems used in combination with a Leica microscope, such as the DM6 M, DMi8 A or M, DM4 M, or DM2700 compound, provides a fast and reliable solution for reproducible characterization of steel quality via non-metallic inclusion analysis.
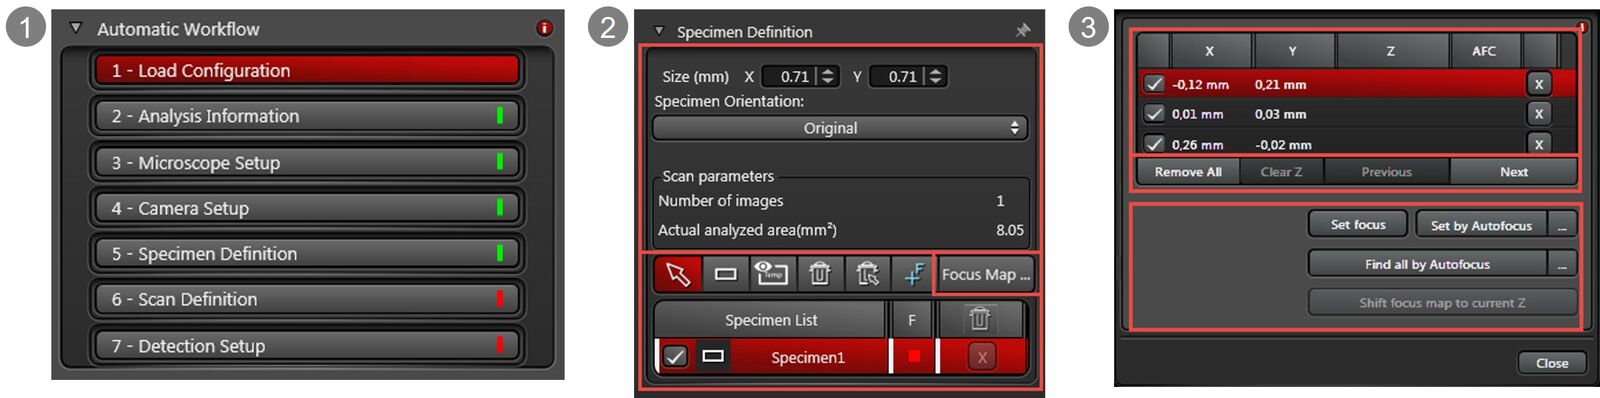
Automated solution
The LAS X Steel Expert automated solution allows fully automatic analysis of multiple samples (figure 15 below). Provided careful sample preparation is done beforehand, a reproducible analysis of entire samples is possible even when the user leaves the system unattended. Results are unbiased and the automated analysis methods are compliant with the international and regional standards already mentioned above. Advanced review capabilities enable discernment between types of inclusions or inclusions and artifacts. The software makes all standards available for comparison during a single scan.
Manual solution
The LAS X Steel Expert manual solution allows analysis of a representative number of areas on the sample (figure 16 below). It is also compatible with standard methods like worst field or worst inclusion. A microscope with motorized stage is not required, as the analysis is carried out manually.
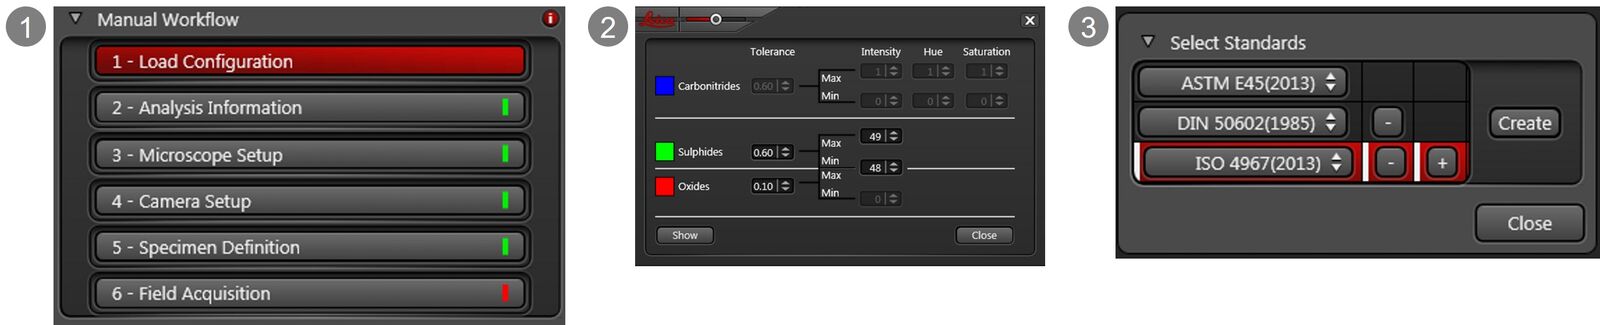
choose the standard and method to be applied.
Report generation (Step IV in workflow)
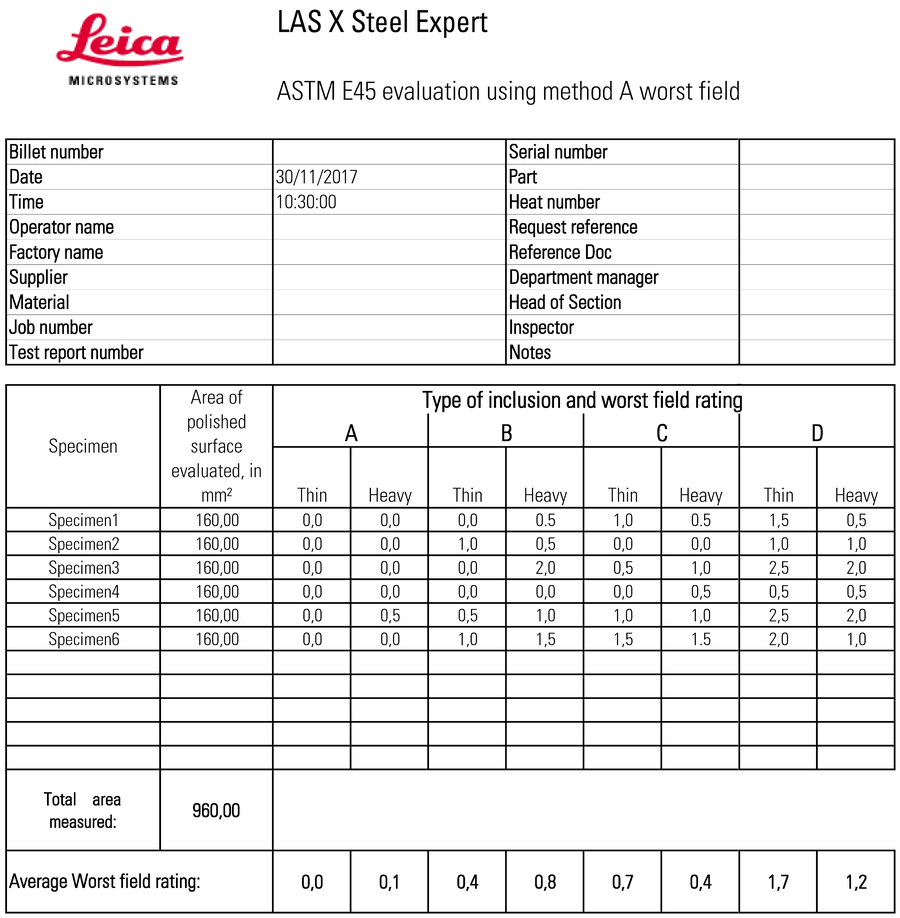
Both the LAS X Steel Expert automated and manual solutions enable easy, rapid report generation from the acquired results. An example of a report showing results obtained with the ASTM E45 standard analysis is shown in figure 17.
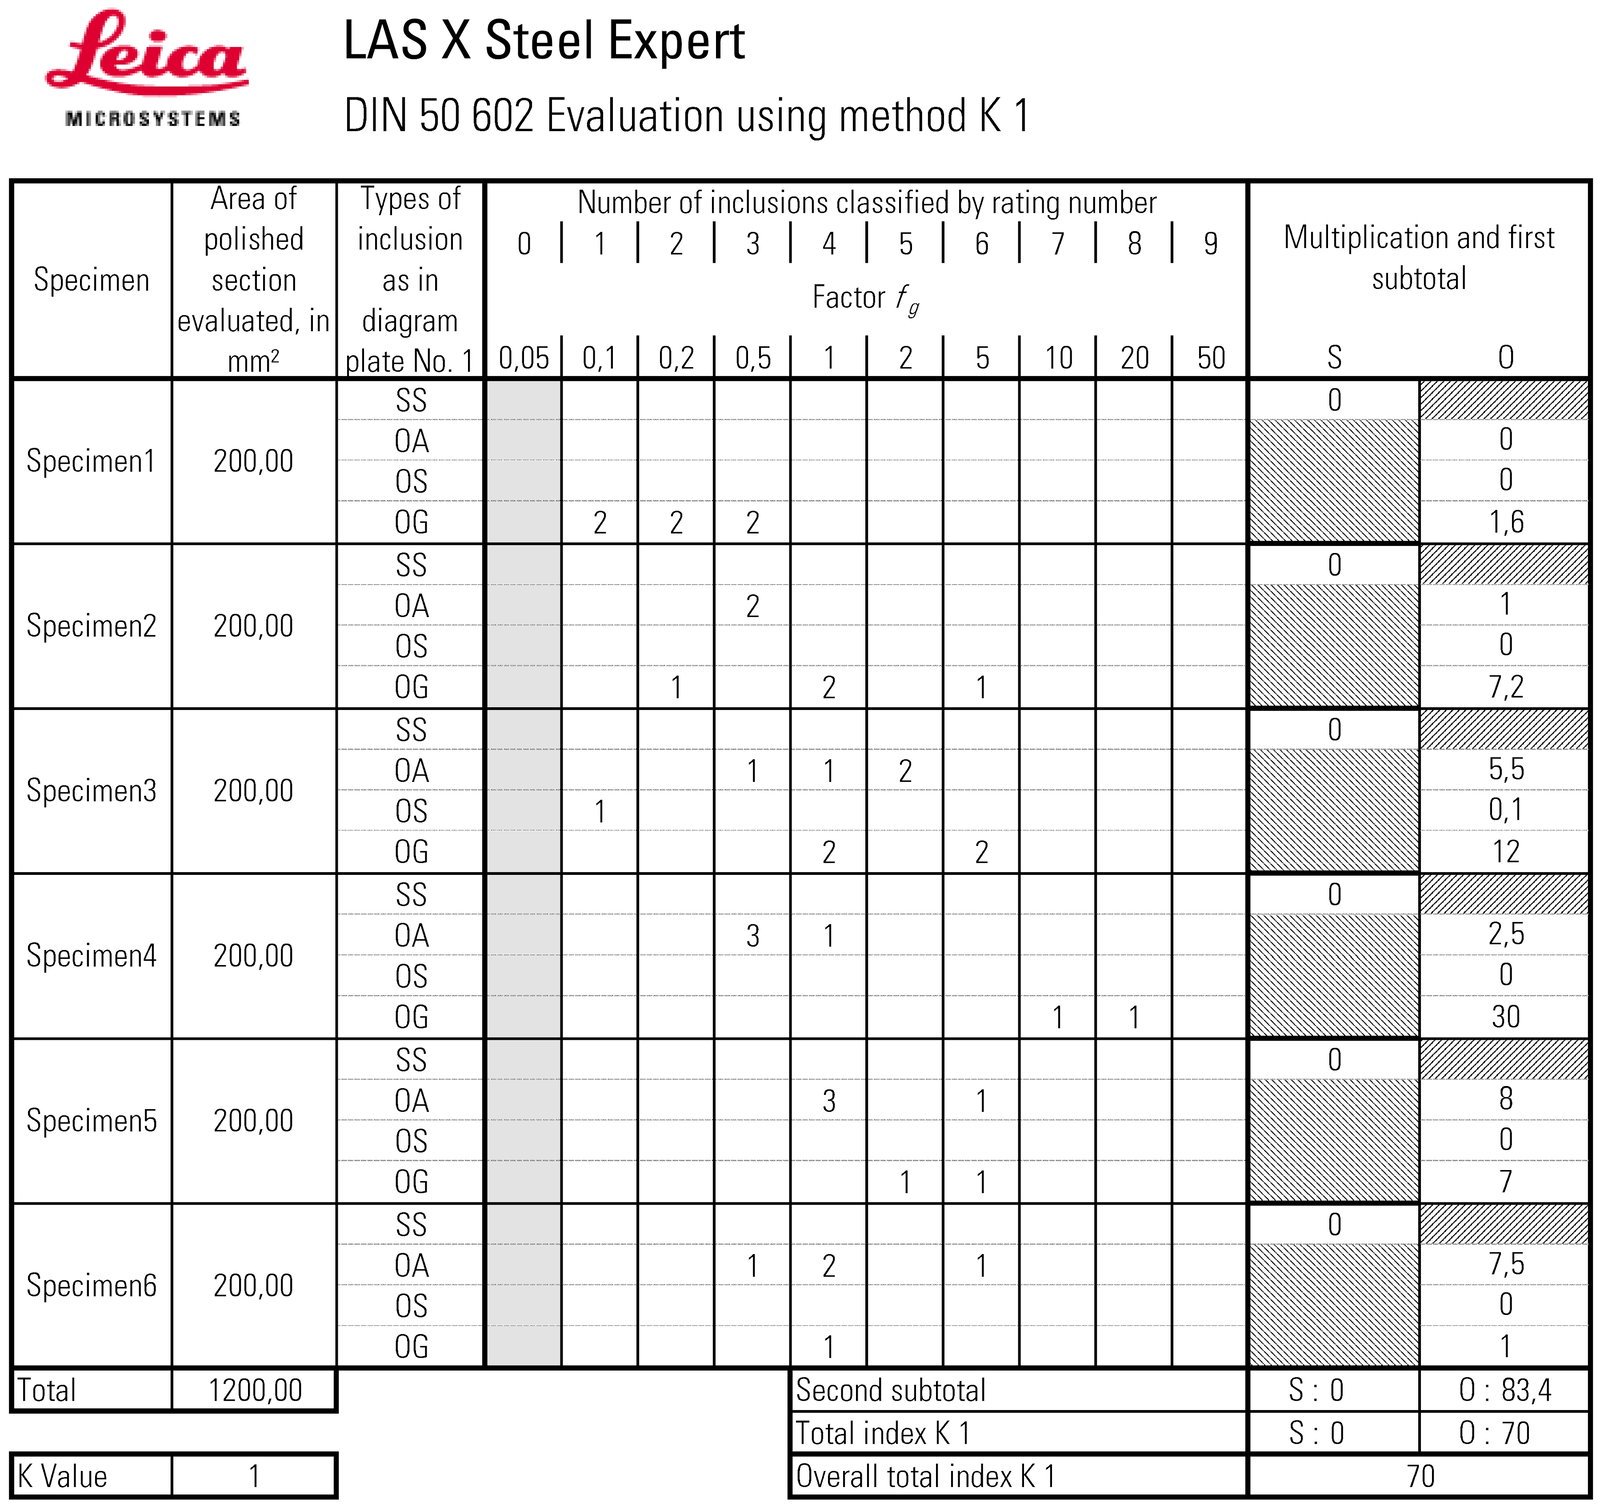
As mentioned above, with either the LAS X Steel Expert automated or manual solution, a report of the results can be quickly generated. Figure 18 shows a report generated with results from the DIN 50602 standard analysis.
Summary
Typically steel quality is evaluated by the characterization and analysis of the non-metallic inclusions present within it. There are a variety of international and regional standards, such as EN 10247, ASTM E45, DIN 50602, and ISO 4967, which describe in detail analytical methods exploited for the rating of steel inclusions. This report gives an overview of how steel quality is determined and presents a practical solution for achieving it.
The quality of steel is essential for industries like transportation, metalworking, electric power, and construction. To ensure compliance with external or internal standards, a precise and reliable quality assurance workflow for the inspection of non-metallic inclusions is critical.
The LAS X Steel Expert software from Leica Microsystems combined with a Leica microscope offers a rapid and flexible, solution for rating the quality of steel in terms of inclusions. There are both automated and manual configurations and the solution can be optimized for the required workflow.

 and oblique (right) brightfield illumination using a Leica compound microscope. The defect on the wafer surface is clearly more visible with oblique illumination.")