
Many cellular functions depend on the dynamic balance of ions, electric potentials, and pH between the cytosol and surrounding extracellular space. Changes in these values affect cellular function. Measuring cellular ion, potential, and pH dynamics is very interesting for biology research, but is difficult to do with conventional fluorescence. How ratiometric imaging overcomes this limitation by allowing the observation of changes in fluorophore emission wavelengths and intensities is explained.
Ion concentrations and pH or potential changes with fluorophore emission shifts
Research activities are increasingly focusing on the identification and spatial and temporal distribution of local “hot spots” for dynamic changes in ion concentration, electric potential, or pH in a cell or cellular network. Such “hot spots” are often localized in specialized parts of a cell or in certain cells in a cellular network. Additionally, these areas often have different properties compared to the rest of the specimen in terms of cell metabolism or structure. Conventional fluorophores used to investigate dynamic physiological states change their emission intensity upon ion binding, pH change, or voltage change, e.g., fluo-4 has increased emission upon calcium binding. However, these markers do not take into account that differences in structure, diameter, or marker uptake/expression can cause changes in the quantity of emitted light that do not correlate with the actual ion concentration, voltage, or pH. To quantitatively and comparably detect the changes in cellular structures or different cells, a method insensitive to structure diameter and fluorophore concentration is needed. In contrast to conventional fluorescence imaging methods, ratiometric imaging offers the opportunity to reproducibly measure absolute intracellular ion, electric potential, and pH levels and changes with respect to cell diameter, fluorophore concentration, and optical properties of the imaging setup [1-4]. However, ratiometric imaging depends on a fast change of excitation wavelength or the detected wavelength, a strong light source, excellent transmission of optical components, and fast signal detection. Ultrafast filter wheels, UV-light optimized objectives, highly sensitive fluorophores, and CMOS (complementary metal oxide semiconductor) cameras allow affordable, quantitative, high-speed imaging of live cells with high spatial resolution.
Dual wavelength excitation/detection is key for measuring emission shifts
As mentioned above, with ratiometric imaging an emission shift, instead of a mere intensity change, is imaged. To measure emission shifts, intensity changes of a fluorophore or combination of fluorophores have to be measured either by using two different excitation wavelengths or detecting at two different emission wavelengths. For the case of the commonly used calcium imaging dye fura-2, it has to be excited with light wavelengths of 340 nm and 380 nm and the detection wavelength is 510 nm. In contrast to that, the calcium imaging dye indo-1 is usually excited with light of 350 nm and the detection wavelengths are 405 nm and 485 nm.

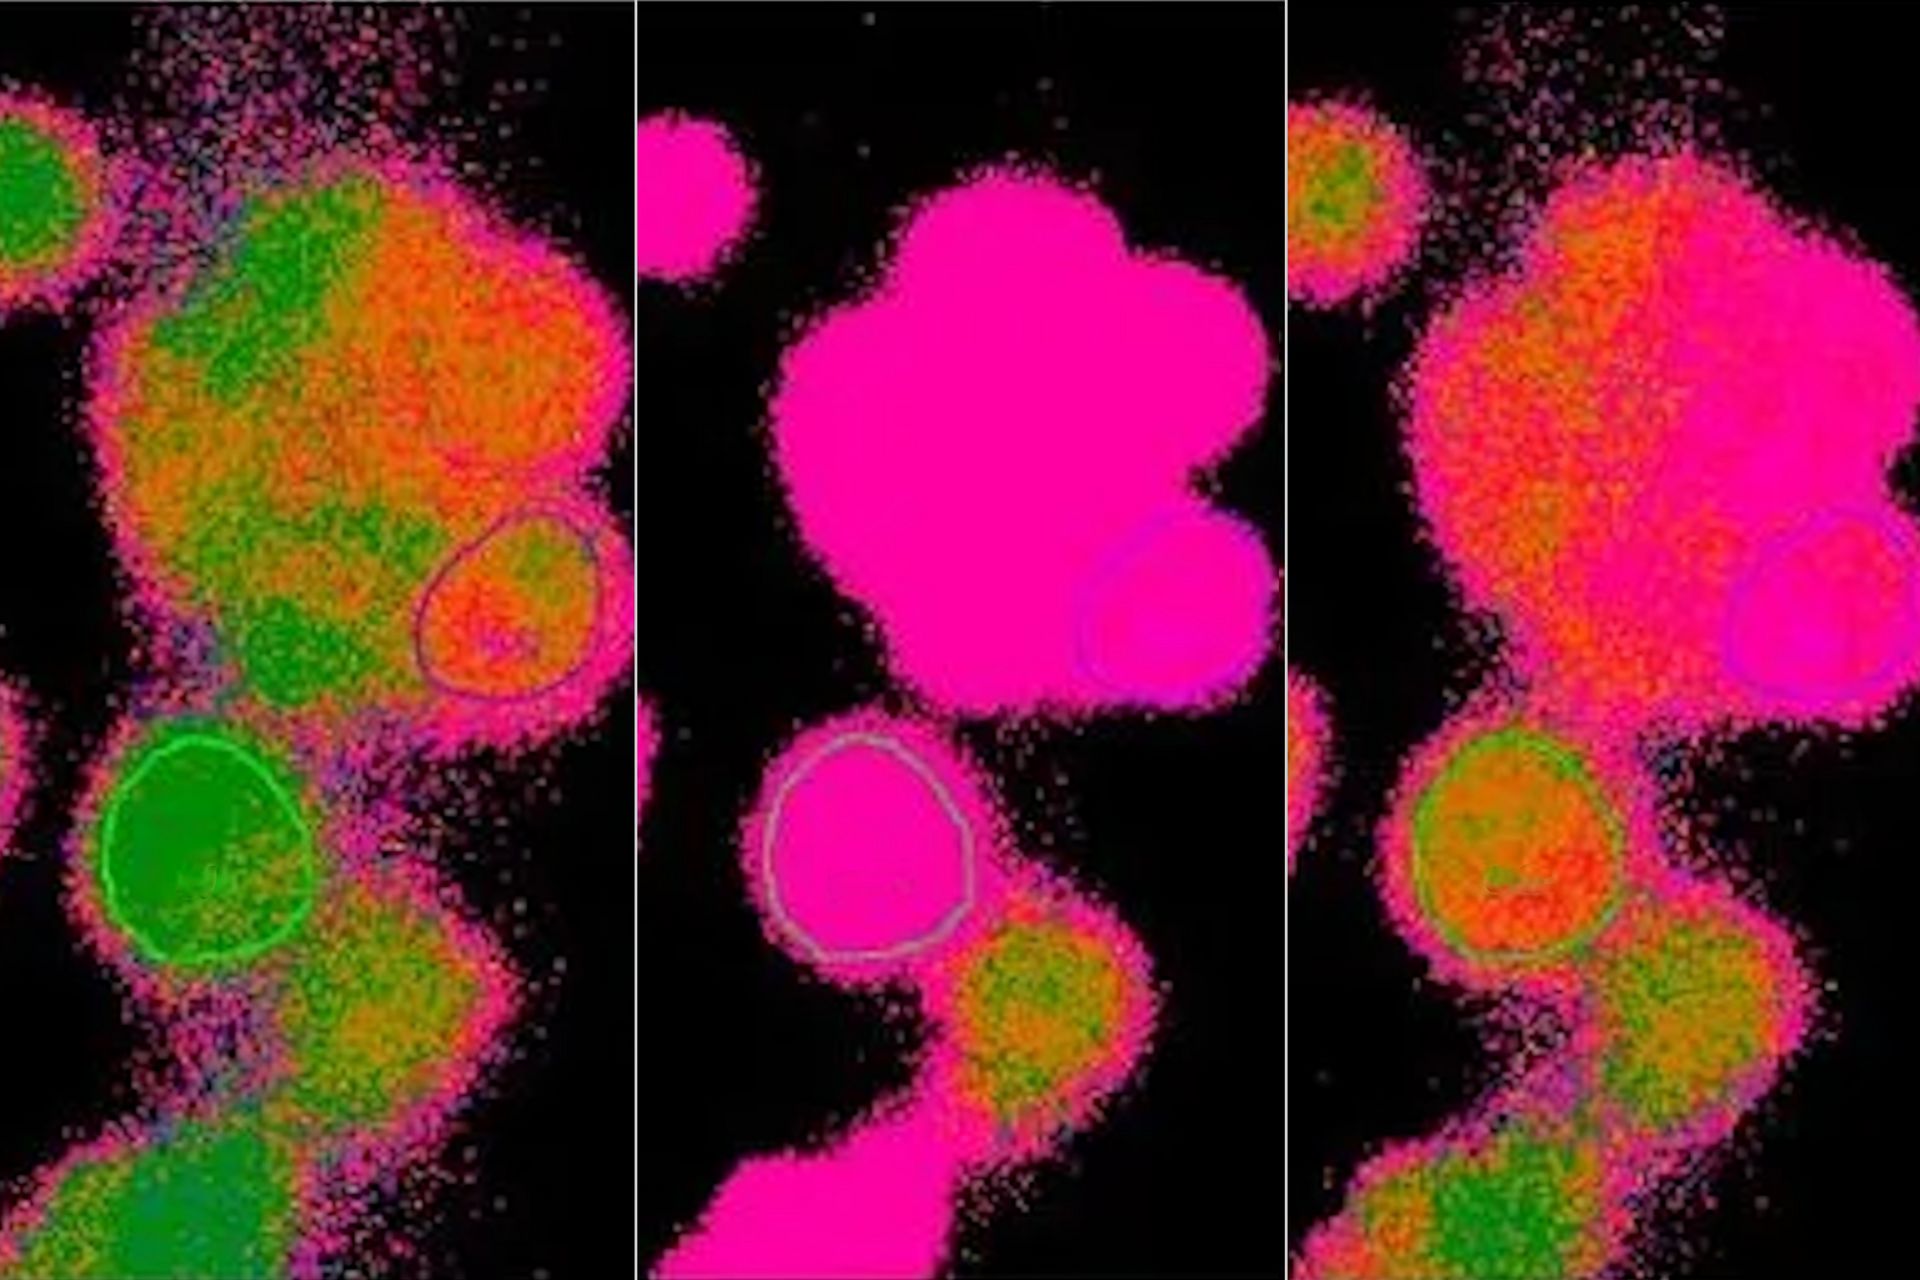
Fig. 1: Snapshots from time-lapse imaging of calcium using the ratiometric calcium indicator Fura-2. Depicted are false-color images after 340 nm (left) and 380 nm (middle) excitation and the corresponding calculated ratio image (right). The image series shows three points in time: At the first point in time (1) cells are not stimulated and the intracellular calcium is at the resting ground state. At the second point in time (2) cells are stimulated and the calcium is at maximum level. At the third point in time (3) the intracellular calcium level is declining. In the graph, the corresponding points in time are marked with 1, 2, and 3. The upper graph shows the intensity of the 340 nm images, the middle graph that of the 380 nm images, and the lower graph shows the ratio of the intensities.
But why is dual excitation or emission detection necessary? Why not simply measure changes in fluorophore intensity?
Given an experiment where fluorophores are used to detect changes in ion levels, voltage, or pH, the intensity of emitted fluorescence light depends on several factors. These are described in the equation below:

where F = fluorescence intensity; c = fluorophore concentration; d = diameter of the specimen (z-axis); K = optical constants of components in the light pathway (cell properties, objectives, filters, etc.); and f(x) describes the emission behavior of a given fluorophore, e.g., if ions are bound or voltage or pH changes occur.
Equation 1 shows that the light intensity very much depends on the amount of fluorophore in the optical path. The amount of fluorophore in the optical path depends on the actual concentration (c) of fluorophores in the cell (determined by marker uptake or expression) and the diameter of the specimen (d) that is imaged. This fact makes it hard to directly estimate the concentration of investigated ions, pH levels, or voltage changes by simply observing the fluorescence intensity. It cannot be simply assumed that “an intensity of 100 equals 100 nM of free calcium in a cell”. Specimen diameter (d), fluorophore concentration (c), and optical properties of the specimen and setup (K) often are not measurable, but substantially influence the overall intensity detected. Additionally, it has to be kept in mind that the formula shown above is true for any given point in the specimen. As the diameter (d) and the fluorophore concentration (c) are not homogeneous throughout a specimen or even within a single cell, the values for c and d might be different for every pixel in an acquired image of a specimen or cell. For example, if at point “A” in the specimen the cell diameter is rather high and free calcium rather low, the light intensity might be the same as at point “B” where it is the opposite. However, scientists could wrongly conclude that the calcium concentration is similar in both places, as the detected fluorescence light intensity is similar.

Fig. 2: The diagrams above illustrate misinterpretations that might occur if the calcium concentration within a cell is judged by the intensity of the emitted light of a non-ratiometric calcium-sensitive fluorophore. The graphs below each diagram represent the light intensity in regions of interest (ROIs) within a cell. In the upper diagram (A), the cell has different thicknesses (d in equation 1) in different compartments like cellular protrusions which are often fine structures (e.g., dendrites and axons of neurons). As all fluorophores within the light path are excited by the excitation light and their emitted light is collected, thicker parts of a cell appear much brighter than thin parts. This result can lead to the assumption that the calcium concentration in the thicker parts of the cell is higher than in comparably thinner parts, although the actual calcium concentration is the same. In the lower diagram (B), a different situation is illustrated. In some cell types, the fluorophore take up might differ between cellular compartments. For the situation in diagram B , the calcium concentration (c in equation 1) in the thicker parts of the cell is higher, but the fluorophore concentration in this area is lower. As the detected fluorescence intensity of the calcium-sensitive dye not only depends on the calcium concentration in the cell, but also on the fluorophore concentration, one might get the impression that the calcium concentration in the whole cell is the same.
To overcome these issues and make precise measurements of absolute ion concentrations, pH levels, or voltage, ratiometric imaging has been developed. Ratiometric methods measure the intensity of emitted light twice. Then a ratio (R) of these intensities is calculated. Depending on the fluorophores or combination used, the fluorophores are either excited with light of two different wavelengths and the emission intensity is measured at one wavelength or they are excited with light of one wavelength and the emission is measured at two different wavelengths. This approach simply means that two gray-value images are acquired and a ratio image is calculated from them. The two gray-value images usually differ in intensity, but the intensity of every single pixel in the image can be described by equation 1 shown above.
As the name “ratio imaging” implies, a ratio value for every pixel of the two simultaneously acquired images is calculated. For example, if the very commonly used calcium sensitive dye Fura-2 (excitation at 340 and 380 nm) is used, the resulting equation would be:
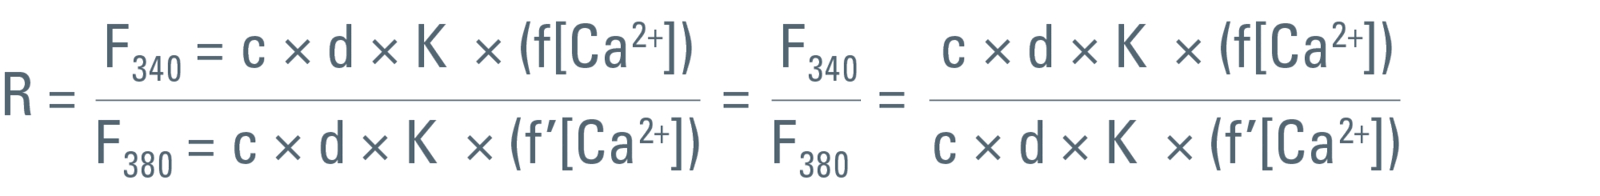
According to simple mathematics, c, d, and K can be canceled and the ratio can be described as:
Virtual ratio image calculated from two gray-value images
In practice, often the ratio is calculated by a computer online during a time-lapse imaging experiment. By calculating the ratio of the gray values for corresponding pixels of two independently acquired gray-value images, the ratio image is created. Remember that gray-value images are basically a matrix of gray values with the size of the camera resolution or the ROI (region of interest), usually 512 x 512 pixels, but can be more than 1,000 x 1,000 pixels. For a calcium-imaging time-lapse experiment with the dye Fura-2 (excitation at 340 nm and 380 nm, emission at 510 nm), it would work as shown in figure 3 below (assuming that the images have the size 3 x 3 pixels).

Fig. 3: Simplified illustration of intensity readout values that a CMOS digital camera might deliver to a computer during a calcium-imaging experiment using the calcium probe fura-2. In this case, each image would be 3 x 3 pixels in size. The upper three matrices represent the intensity readout values for the calcium ions at resting ground state with 340-nm and 380-nm excitation plus the corresponding ratio value. The lower three matrices represent the intensity value changes after a calcium increase in the highlighted pixels. The values at 340-nm excitation increase, whereas the values at 380-nm excitation decrease. However, the corresponding ratio values will also increase.
Advantage of ratiometric imaging for fluorescence methods like FRET
Besides the advantages mentioned above, calculating the ratio has an additional advantage. When performing live-cell imaging with ion-, voltage- or pH-sensitive fluorophores, minute changes in fluorescence intensity at the respective wavelength often occur. For ratio imaging, however, an intensity increase at one wavelength and an intensity decrease at the other wavelength is observed in most cases, no matter whether the probe is excited or detected with two wavelengths. If the ratio of both acquired images is subsequently calculated, the difference between baseline and signal amplitude will be enhanced compared to the mere intensity change of the fluorophore. Hence, ratio imaging increases the amplitude of detected signals. It is of special interest for FRET (fluorescence resonance energy transfer) assays with fluorescent proteins where the fluorescence intensity of the donor protein decreases and that of the acceptor protein increases during the energy transfer [5].
 and phalloidin (magenta), imaged using Viventis SCAPE; scale bar 50μm. Courtesy of Marina Cuenca and Heleen Jungen (Dayton lab), EMBL Barcelona.")