How do we define "fluorescence"?
Typing the phrase "definition of fluorescence" into any search engine and you will get the following phrase, or something very similar;
"The emission of visible or invisible radiation from certain substances as a result of incident radiation of a shorter wavelength such as X-rays or ultraviolet light."
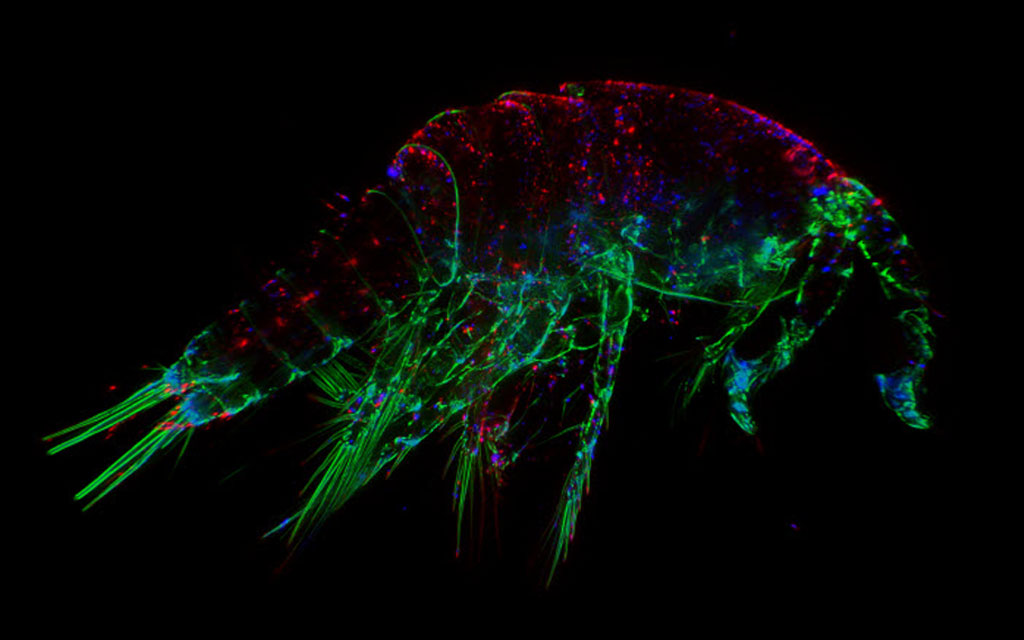
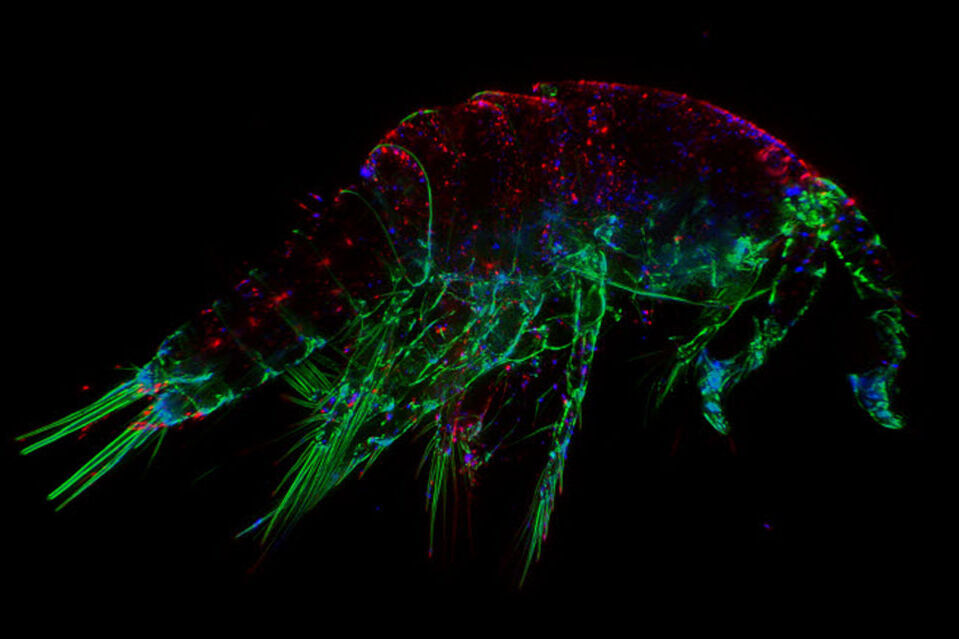
How does this definition relate to fluorescence microscopy (Figure 1)? The "incident radiation of a shorter wavelength" is simply the light source used to "excite" the fluorophores in a sample. This light can include the visible spectrum, ultraviolet (UV) and infra-red (IR) and the source in a microscope can range from a mercury or xenon arc lamp to lasers. The fluorophores ("certain substances" in the above definition) are chemical compounds which have special properties whereby they can reemit higher wavelength light/photons upon excitation by light which has a lower wavelength.

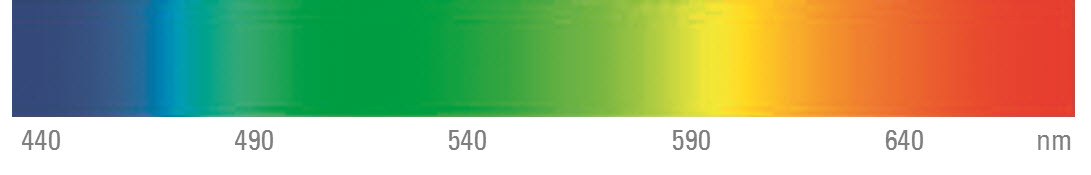
The basic unit of wavelength is the meter and "wavelength" is defined as the distance between two successive peaks or troughs of a light wave. The symbol for wavelength is the Greek letter lambda (l). The wavelengths which are typically used in microscopy are in the nanometre (nm) range within the visible spectrum between 400 and 700 nm, the UV spectrum below 400 nm and the IR spectrum which starts at 700 nm (Figure 2).
Fluorophores are categorised by their excitation and emission wavelengths which is usually in the form of a graph displaying the maximum peaks. Fluorophores are naturally stable in what is termed the "ground state". When they absorb a photon of light (from the "shorter wavelength" light), the energy of the photon raises the electrons of the fluorophore to a higher energy "excited" state. The excited electrons do not remain in this state, but lose the vibrational energy and emit a photon of a longer wavelength on their return to the ground state. For the fluorophores used in microscopy, one complete cycle from excitation to the return to ground takes in the region of 0.5 to 20 nanoseconds.
Fluorophore excitation and emission wavelengths are commonly abbreviated as the Greek letter lambda with a subscript "ex" (excitation) or "em" (emission; lex or lem).
Each fluorophore has a distinct maximum excitation and emission spectra and this property is used to distinguish different targets in the same specimen of interest. For example, using the fluorescent stain DAPI (4'.6-diamidino-2-phenylindole) to highlight the nuclear proteins in a cell along with fluorescently-labelled phalloidin to highlight the actin cytoskeleton.
The Jablonski Diagram of fluorescence
The Polish physicist Professor Aleksander Jablonski (1898-1980) was the first to describe the cycle between ground/excitation/emission in a three-level energy diagram which is known simply as a "Jablonski Diagram". In 1930, he received his PhD from Warsaw University for his thesis entitled "On the influence of the change of the wavelength of excitation light on the fluorescence spectra". It was in 1933 that he published his paper ("Efficiency of Anti-Stokes Fluorescence in Dyes") in Nature which contained the Jablonski Diagram. This simple yet effective illustration of the behaviour of fluorophores highlights the excitation from ground state to excited state and back to ground with the emission of a photon of longer wavelength (Figure 3).

Although Figure 3 is a simplified Jablonski Diagram, it should be noted that fluorophores can exist in many different states of excitation and emission. Furthermore, fluorophores may return to ground via varying states of relaxation known as "triplet states" depending upon the electron spin of the molecules.
The Stokes Shift
Sir George Gabriel Stokes (1819-1903) was an Irish mathematician and physicist, and during his lifetime he made many discoveries and advances in the fields of optics and light. He was appointed the Lucasian Professor of Mathematics at Pembroke College, Cambridge in 1849 and remained in this position until his death in 1903. He wrote a beautifully descriptive paper which was published in 1852 and called "On the Change of Refrangibility of Light" [1]. The language used in this text is unlike that which we are used to in modern day scientific literature. Here are two brief extracts of the wonderful language which Stokes used;
"Towards the end of last autumn, when the lateness of the season afforded but few opportunities for observation, I learned from different sources that the kind of yellow glass which has already been mentioned as possessing in so high a degree the property of internal dispersion was coloured with oxide of uranium."
And:
"It was certainly a curious sight to see the tube instantaneously lighted up when plunged into the invisible rays: it was literally darkness visible. Altogether the phenomenon had something of an unearthly appearance."
The "Stokes Shift" was later named in his honour. When the excited electrons return to the ground state and emit a photon of light, the wavelength is always longer than that which was used to excite the fluorophore. This is due to the property of light whereby wavelength is inversely proportional to radiation energy. The Stokes Shift describes the difference (in nanometres) between the peak excitation and the peak emission wavelength of a fluorophore (Figure 4).
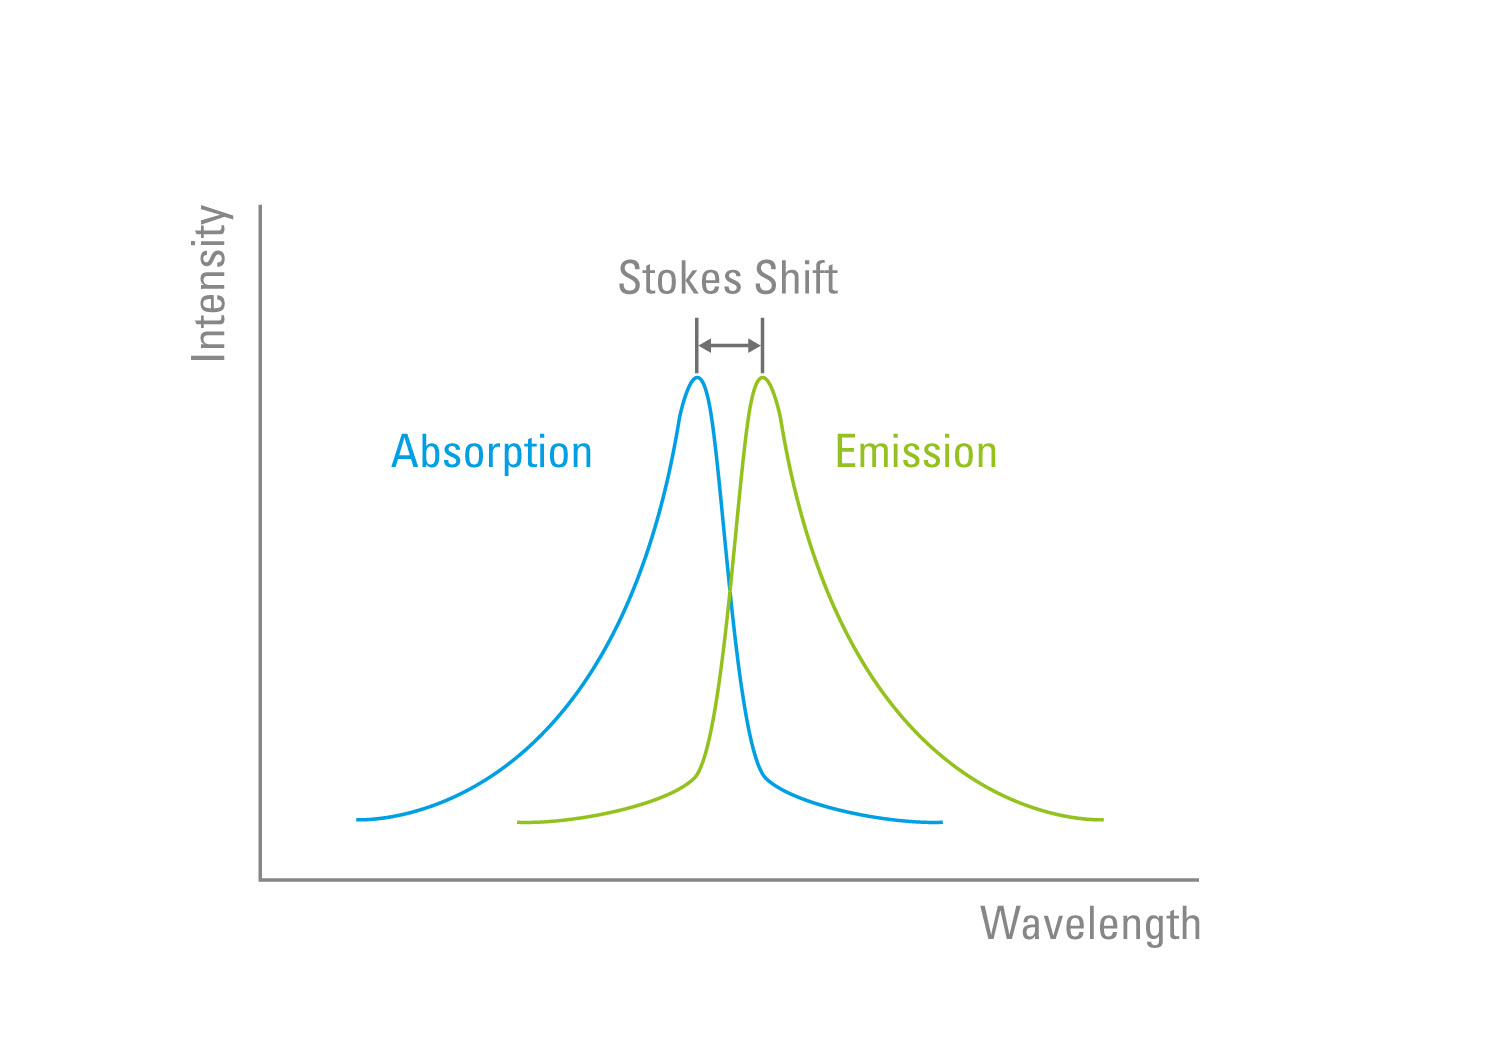
Distinguishing between the excitation and emission from a fluorophore is proportionally easier with an increase in the Stokes Shift. Fluorophores possess unique characteristics in terms of their Stokes Shift which is due to their electron configuration and molecular structure.
The discovery and use of Green Fluorescent Protein
It was Stokes who first used the term "fluorescence" to describe his observed phenomena, but the history stretches as far back as 1565. A Spanish physician and botanist called Nicolas Monardes described a strange blue colour of an infusion of wood from a Mexican tree, Lignum nephriticum. Despite these early observations, it was to be some 400 years later that a green fluorescent substance was reported in a living organism. In 1955 Davenport and Nicol published a paper [2] describing the photogenic tissue in the eosinophils of a subclass of jellyfish known as Hydromedusae. At the time, the authors of this work did not realise that the eosinophils contained a green fluorescent protein (GFP).
It wasn’t until 1962 that Osamu Shimomura (*1928) published a paper [3] in which the photogenic component was recognised as a protein. Working with his Professor (Frank Johnson) at Princeton University, they collected samples from the bioluminescent jellyfish Aequorea victoria. They had a unique way of isolating the fluorescent proteins from the jellyfish, namely squeezing the isolated bioluminescent tissue through a cotton bag to produce a solution which Shimomura called "squeezates".
In 1994, Martin Chalfie (*1947) Professor at Columbia University, compiled a paper demonstrating that the gene encoding GFP could be functionally expressed in prokaryotic and eukaryotic cells (namely Escherichia coli and the neurons of Caenorhabditis elegans) [4]. The paper stated that "because exogenous substrates and cofactors are not required for this fluorescence, GFP expression can be used to monitor gene expression and protein localization in living organisms." It was this publication which paved the way for the extensive use of GFP in biological research.

A year later, Professor Roger Tsien (1952-2016) from the University of Califronia, San Diego (who had been researching mutants of the wild-type GFP) published his work in the scientific correspondence in Nature [5]. This discovery of a single-point mutation (S65T) was chosen by Tsien and colleagues as it had the longest excitation and emission wavelengths (490/510 nm) which rendered it more photostable and resulted in the well-known GFP excitation/emission peaks.
In 2008, Shimomura, Tsien and Chalfie were jointly awarded the Nobel Prize in Chemistry for their roles and discovery of GFP. When Shimomura gave his Nobel lecture he said that “When I found the chromophore of GFP in 1979, I thought I had done all I could do with GFP, and decided to terminate my work on GFP in order to concentrate my efforts in the study of bioluminescence”. He went on to admit that “GFP was a beautiful protein but it remained useless for the next 30 years after the discovery.”
Since Tsien’s discoveries, his lab have engineered many variants of GFP which cover much of the visible spectrum and have indeed revolutionised the field of optical microscopy and imaging. Thanks to such genetic engineering, GFP is available in colours ranging from the blue part of the spectrum (EBFP; 380/460 nm) through to the yellow part of the spectrum (YFP; 514/527 nm).
Reporters and probes
As well as the field of imaging, fluorophores can be used as "reporters" to study gene expression in cells and organisms. The enzyme luciferase, as well as the gene encoding GFP, are amongst those which are commonly used to examine whether specific genes are expressed by cells. Organisms or cells are transfected with genetically modified viral DNA or plasmids which fluoresce when the target gene is expressed. The organelles or sites of interest within the cells can then be visualised and examined in the transfected cells.
Antibodies which are labelled (or "tagged") with fluorophores are commonly referred to as "fluorescent probes". Before the widespread use of GFP and the other fluorophores which followed its discovery, two of the most commonly used fluorophores to tag antibodies were FITC (fluorescein isothiocyanate) and TRITC (tetramethyl rhodamine isothiocyanate). Although FITC and TRITC are still used, there have been major advances in the field and the choice of fluorophores and probes is extensive to say the least.
Certainly one of the most extensive ranges of fluorophores used in laboratories today is the "Alexa Fluor" dyes. The current range of Alexa Fluor dyes available spans the visible spectrum with excitation wavelengths ranging from 346 to 784 nm.
Quantum Dots
Quantum Dots (or "Qdots") were first discovered in a glass matrix in 1981 by the Russian scientist Alexey Ekimov whilst working at the Vavilov State Optical Institute in St. Petersburg. However, the first colloidal solutions of Qdots were discovered by Louis Brus who was working on semiconductors at the AT&T Bell Laboratories in New Jersey. He is now the Professor of Chemistry at Columbia University. In two papers published in 1983 and 1984, Brus described Qdots as "small semiconductor crystallites".
Quantum dots behave in a peculiar manner- although they contain between as little as 100 to 100,000 atoms, they exhibit properties as though they were comprised of a single atom. However, they do conform to the properties of a fluorophore whereby they can absorb light energy, become excited and release photons of light when returning to ground state. But the wavelength of light which they emit is dependent on the size of the Qdot- the smaller the Qdot, the shorter the emission wavelength. This property is due to smaller Qdots possessing a larger "minimum band gap". This is the amount of energy which is required to excite an electron to a higher energy state. As smaller Qdots require more energy for excitation, they subsequently emit lower wavelengths of light (wavelength is inversely proportional to excitation energy).
It was almost 20 years later, in 2002, when Qdots became commercially available to life science researchers from the Quantum Dot Corporation, California.
Quantum dots are very bright and stable tools for use in fluorescence applications. Studies have shown that Qdots are several orders of magnitude brighter than conventional fluorophores, although there exists some variation in exactly how much brighter they are compared to organic dyes [6]. In terms of photostability, Qdots have been reported to be up to 100-times more stable than conventional fluorophores and in one in vivo imaging study, they remained fluorescent for up to four months [7].
In conventional fluorescent probes, one or more fluorophores can be attached to a single antibody of interest. However, due to the very large surface area of Qdots, many molecules and antibodies can be attached to a single dot which can have many advantages including fluorescent signal amplification. The use of Qdots also offers an advantage in multiplex assays in which a variety of wavelengths can be simultaneously imaged. In such assays, the only variable is the size (and hence emission wavelength) of Qdot which is selected by the researcher. Excitation of a wide range of Qdots can be performed simultaneously with white light which negates the use of multiple lasers and many adjustments to form the final image.
References
- On the change of refrangibility of light; G. G. Stokes, M. A., F. R. S. Phil. Trans. R. Soc. Lond. 1852 142, 463-562, published 1 January 1852
- Luminescence in Hydromedusae D. Davenport; J. A. C. Nicol, Published 29 November 1955. DOI: 10.1098/rspb.1955.0066
- Extraction, purification and properties of aequorin, a bioluminescent protein from the luminous hydromedusan, Aequorea. J Cell Comp Physiol. 1962 Jun;59:223-39.
- Green fluorescent protein as a marker for gene expression; Science 11 Feb 1994: Vol. 263, Issue 5148, pp. 802-805 DOI: 10.1126/science.8303295
- Improved Green Fluorescence; Nature Volume 373, 23. February 1995
- QDs versus Alexa: reality of promising tools for immunocytochemistry; Journal of Nanobiotechnology
- Noninvasive Imaging of Quantum Dots in Mice; Bioconjugate Chem., 2004, 15 (1), pp 79–86 DOI: 10.1021/bc034153y; Publication Date (Web): December 30, 2003
 and phalloidin (magenta), imaged using Viventis SCAPE; scale bar 50μm. Courtesy of Marina Cuenca and Heleen Jungen (Dayton lab), EMBL Barcelona.")
, tubulin with Cy5 (red), and nuclei with DAPI (blue). Image courtesy of Dr. Günter Giese, Max Planck Institute for Medical Research, Heidelberg, Germany.")
, Tropomyosin (cardiomyocytes, red) and GFP (primordial cardiac layer, green).")
