An introduction to commonly used fluorescent dyes and an overview of their characteristics are given in this article. Fluorescence microscopy is used for the study of specific cellular components with the help of fluorescent dyes, fluorescent proteins, or immunofluorescent stains using antibodies. Thanks to a large variety of fluorescent agents, fluorescence microscopy can be used to examine proteins, nucleic acids, glycans, organelles, and other cellular structures.
Fluorescent dyes and microscopy
Fluorescent agents are used with fluorescence microscopy to visualize specific cellular components in a specimen. An agent can be a fluorescent dye, like ATTO Rho6G (rhodamine), a fluorescent protein, such as GFP (green), or an immunofluorescent stain, e.g. ATTO 488-antibody conjugate. Fluorescent proteins are genetically linked and expressed within the cellular protein of interest [1]. They are generally used to study live cells. In some cases, fluorescent proteins can cause dysfunction or misinterpretations concerning the cellular protein of interest. If protein cloning is impossible or impractical, for instance concerning histological specimens, techniques like immunofluorescent staining are used to visualize cellular proteins of interest. For this purpose, antibodies are linked to distinct fluorescent dyes in order bind them either directly or indirectly to the target structure. Even application-specific varieties of live-cell dyes are available which allow visualization of organelles, e.g., the endoplasmic reticulum (ER), mitochondria, and Golgi. There are also functional assays for labelling live cells to track processes like proliferation and apoptosis as well as differentiate between live and dead cells (live/dead assays). Even non-biological substances like calcium (Ca) ions in cells can be detected with fluorescent calcium indicators. The text below gives an overview of the most commonly used fluorescent dyes.
Fluorescent labeling with click chemistry
In general, “click chemistry” takes advantage of chemical reactions with no harmful byproducts, high chemical yields, and stable products [2]. Scientists can make use of click chemistry to exploit chemical reactions that are able to quickly and reliably generate substances by joining together small units. It allows them to use unnatural amino acids (UAAs) for orthogonal fluorescent labeling of biomolecules with antibodies and nanobodies. Azide and alkyne functionalized dyes from ATTO-TEC and other companies are available for click chemistry applications [3]. Examples of click chemical reactions are the copper catalyzed Huisgen azide alkyne cycloaddition forming a triazole link between the dye and target molecule and DBCO derivative dyes as click-reagents for a catalysis free, strain promoted azide alkyne cycloaddition [3].
Immunofluorescent dyes
With the help of fluorescently labeled antibodies that bind to specific proteins of interest in a cell, these proteins can be studied with fluorescence microscopy. For the case of histological specimens, it is not possible to use fluorescent proteins because, in general, the specimen is derived from an organism which does not express any fluorescent proteins. Furthermore, if a functioning antibody is available, using immunofluorescence is much faster than fluorescent protein techniques.
Immunofluorescence takes advantage of the very specific binding affinity of an antibody to its antigen. It is done using two different approaches. Direct immunofluorescence is the easiest way where a fluorescently labeled antibody is directly bonded to a protein of interest. However, in most cases indirect immunofluorescence is used. It requires two types of antibodies where the first one (primary antibody) binds to the target protein, but is not fluorescently labeled itself. The second one (secondary antibody) is bound to the primary antibody and specifically carries a fluorescent dye. Indirect immunofluorescence has several advantages. On the one hand there is an amplifying effect, because often more than one secondary antibody binds to the primary antibody. On the other hand, it is generally easier to find secondary antibodies, rather than primary antibodies, labeled with the fluorescent dye of interest.
FITC and TRITC
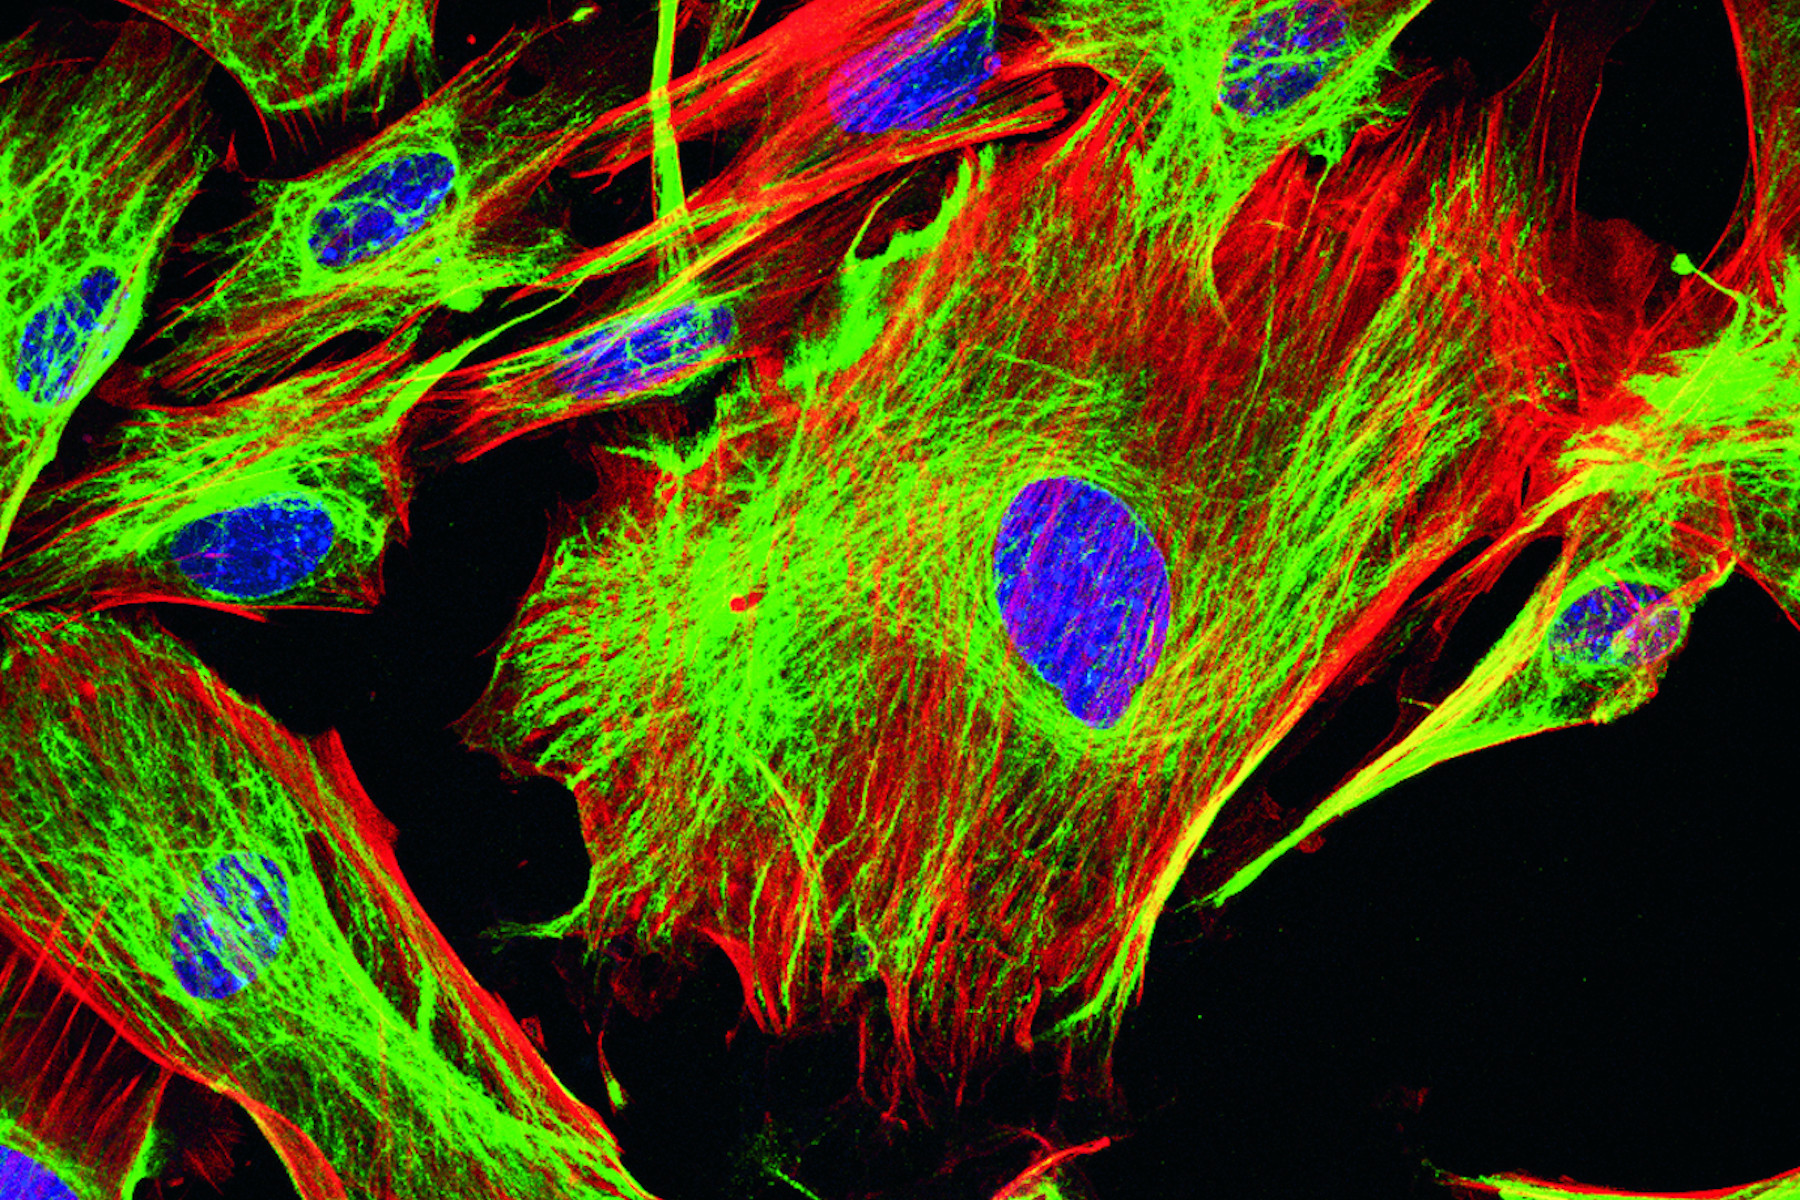
Fluorescein isothiocyanate (FITC) is an organic fluorescent dye and probably one of the most commonly used in immunofluorescence and flow cytometry. It has an excitation and emission peak of 495 and 517 nm and can be coupled to distinct antibodies with the help of its reactive isothiocyanate group which binds to amino, sulfhydryl, imidazoyl, tyrosyl, or carbonyl groups of proteins. FITC was one of the first dyes used for fluorescence microscopy and served as a precursor for other fluorescent dyes like ATTO 488, Alexa 488, and others. Its fluorescence activity is due to its large conjugated aromatic electron system which is excited by light in the blue spectrum. An example of a specimen stained with ATTO 488 is shown below in figure 1.

Fig. 1: Image of methanol fixed MDA-MB-468 cells where the EGF-receptor is stained with AZ-271-labeled affibody (red), Ki67 with rabbit IgG anti Ki67 (primary), ATTO-647N-labeled donkey IgG-fab2-fragment anti rabbit (secondary, blue), tubulin-antibody staining with mouse IgG anti beta tubulin (primary), and donkey IgG-fab2-fragment anti mouse labeled with ATTO 488 (secondary, green).
A dye very often used in combination with FITC is TRITC (Tetramethylrhodamine-5-(and 6)-isothiocyanate). In contrast to FITC, TRITC is not a fluorescein, but a derivative of the rhodamine family. Rhodamines also have a large conjugated aromatic electron system which enables their fluorescent behavior. TRITC is excited with light in the green spectrum with a maximum at 550 nm. Its emission maximum is at 573 nm. The bonding to proteins with antibodies is based on a reactive isothiocyanate group.
Even though FITC and TRITC are still widely used, they are rather weak fluorescent dyes due to their low photostability and poor water solubility, so not recommended for state-of-the-art microscopy.
Other types of dyes
ATTO dyes or labels include many hydrophilic fluorescent dyes, fluorescence quenchers, as well as large Stokes-shift and redox dyes, which are all used for fluorescence microscopy. Some ATTO dyes are based on basic fluorescent substances like coumarin, rhodamine, carborhodamine, oxazine, or acridine. Examples include ATTO 386H, ATTO 465, ATTO 532, ATTO 647N, and ATTO 680. For example, ATTO 488 has an excitation maximum at 500 nm and an emission maximum at 520 nm. It has similar properties to FITC, but shows better stability, brightness and lower pH sensitivity. Examples of specimens dyed with different ATTO dyes are shown below in figures 2 and 3.
 where the liquid-ordered phase is marked with ATTO 488-DPPE (green) and the liquid-disordered phase with ATTO 647N-DOPE (red).")
Fig. 2: Phase-separated giant-unilamellar-vesicles (equatorial scan) where the liquid-ordered phase is marked with ATTO 488-DPPE (green) and the liquid-disordered phase with ATTO 647N-DOPE (red).
 and donkey IgG-fab2-fragment anti-mouse was labeled with ATTO 488 (secondary).")
Fig. 3: Methanol fixed MDA-MB-468 cells where tubulin-antibody staining was done for mouse IgG anti beta tubulin (primary) and donkey IgG-fab2-fragment anti-mouse was labeled with ATTO 488 (secondary).
DNA/RNA (nucleic acid) staining
Sometimes scientists might have to study nucleic acids in cells, for example, to count specific types of cells or determine their exact positions by detecting their nuclei, with the help of fluorescence microscopy. One of the most common DNA stains is DAPI (4',6-diamidino-2-phenylindole) which binds to A-T rich regions of the DNA double helix. DAPI fluorescence intensity increases if attached to DNA compared to its unbound state. It is excited by UV light with a maximum at 358 nm. Emission spectrum is broad and peaks at 461 nm. A weak fluorescence can also be detected for RNA binding. In this case, emission shifts to 500 nm. Interestingly, DAPI is able to permeate an intact plasma membrane which makes it useful for fixed and living cells.
Other often used DNA stains are Hoechst dyes. Hoechst 33258, Hoechst 33342, and Hoechst 34580 are bisbenzimides with a tendency to intercalate adenine-thymine (A-T) rich areas of DNA. Similar to DAPI, these dyes are excited by UV light and have an emission maximum at 455 nm when bound to DNA (510 to 540 nm when not bound). Hoechst stains are cell permeable and, therefore, can be used in fixed and living cells. Also, they exhibit a lower toxicity than DAPI.
A membrane-impermeable DNA stain is propidium iodide which is often used to differentiate between living and dead cells in cell culture, because it cannot enter an intact cell. Propidium iodide is also an intercalating agent, but with no binding preference for distinct bases. In the nucleic acid bound state, its excitation maximum is at 538 nm and highest emission at 617 nm. Unbound propidium iodide excitation and emission maxima are shifted to lower wavelengths and lower intensity. It can also bind to RNA without changing its fluorescent characteristics. To distinguish DNA from RNA, it is important to use adequate nucleases.
A dye which is capable of differentiating between DNA and RNA without any modification is acridine orange. Its excitation/emission maximum pair is 502 nm/525 nm when bound to DNA and becomes 460 nm/650 nm when bound to RNA. Furthermore, it can enter acidic compartments like lysosomes where the cationic dye is protonated. In this acidic surrounding acridine orange is excited by light in the blue spectrum, whereas emission is strongest in the orange region. It is often used to identify apoptotic cells, as they have a lot of engulfed acidic compartments.
Compartment and organelle specific dyes
There is a number of specific dyes which are used to study cell compartments, such as, lysosomes, endosomes, or vacuoles (found in yeast like S. cerevisiae) as well as organelles, e.g., mitochondria, endoplasmic reticulum (ER), Golgi apparatus or body, and nuclei. Figure 4 and 5 below show examples.
Cell compartments and organelles can be stained with antibody labeling kits from ATTO-TEC [3]. Scientists can take advantage of polyclonal and monoclonal IgG antibodies or other proteins, e.g., the ATTO 488 and ATTO 643 conjugates, to efficiently label specimens.
The ER is usually stained when studying protein secretion. One classical dye to stain this organelle is DiOC6(3) [3,3′-Dihexyloxacarbocyanine,iodide], a green fluorescent, lipophilic dye which permeates cells and has a preference for the ER membrane [4]. However, it can still bind to membranes of other organelles like the mitochondria [4].
It is also possible to stain the area of interest with the help of proteins with preferences for distinct locations in the cell. One example is the use of wheat germ agglutinin (WGA) which binds specifically to sialic acid and N-acetylglucosaminyl present in the plasma membrane.
![Purkinje cell or neuron in a triple labeled parasagittal section of a mouse cerebellar cortex. In the image, red indicates calbindin-D28k calcium-binding proteins (anti-calbindin-D28k/Cy3), green glial fibrillary acidic proteins (GFAP) [anti-GFAP/Cy5], and blue nuclei (Hoechst 33258).](/fileadmin/academy/2026/Overview_of_Fluorescent_Dyes_in_terms_of_Applications_and_Properties/Purkinje_cell_neuron_in_parasagittal_section_of_a_mouse_cerebellar_cortex.jpg "Purkinje cell or neuron in a triple labeled parasagittal section of a mouse cerebellar cortex.")
Fig. 4: Purkinje cell or neuron in a triple labeled parasagittal section of a mouse cerebellar cortex. In the image, red indicates calbindin-D28k calcium-binding proteins (anti-calbindin-D28k/Cy3), green glial fibrillary acidic proteins (GFAP) [anti-GFAP/Cy5], and blue nuclei (Hoechst 33258).
, anti-α-tubulin-ATTO 488 (microtubules, green), and anti-TOMM20-ATTO 643 (mitochondria, red). The image was taken with confocal microscopy.")
Fig. 5: U2OS human osteosarcoma cells stained with DAPI (nucleus, blue), anti-α-tubulin-ATTO 488 (microtubules, green), and anti-TOMM20-ATTO 643 (mitochondria, red). The image was taken with confocal microscopy.
Many important cellular processes, including organelle and vesicle movement, cell motility, cell division, cytokinesis, cell signaling, and maintaining cell shape, involve actin. Actin is a group of globular multi-functional proteins which make up microfilaments in the cytoskeleton. Phalloidin conjugates available for all ATTO dyes can provide a powerful tool to stain and visualize actin filaments [3].
Phospholipids play a major role in cell structure and function. Due to their amphiphilic nature and the ability to form lipid bilayers phospholipids are the predominant building block of biological membranes, such as plasma and intracellular membranes. Labeled membrane probes like phospholipids are useful tools to investigate cell
structures, lipid metabolism, signal transduction, transmembrane diffusion, and others. A variety of phospholipids based on glycerol carrying one or two fatty acids (lipophilic groups) and a phosphate monoester residue (hydrophilic group) which is fluorescently labeled are offered by ATTO-TEC [3]. Examples include 1,2-dipalmitoyl-sn-glycero-3-phosphoethanolamine (DPPE), 1,2-dimyristoyl-sn-glycero-3-phosphoethanolamine (DMPE), 1,2-dioleoylsn-glycero-3-phosphoethanolamine (DOPE), 1-palmitoyl-2-hydroxy-snglycero-3-phosphoethanolamine (PPE), and 1,2 dilauroyl-sn-glycero-3-phosphoethanolamine (DLPE) which are labeled with selected ATTO dyes.
Ion imaging
For the case of neuronal studies, gene activity or cellular movement it is of interest to study ion concentrations in the cell. Sodium, calcium, chloride, or magnesium ions have a deep impact on many different cellular events. Typically, ions can be trapped with the help of fluorescently labeled chelators that change their spectral properties when bound to the appropriate ions. Examples of labelled chelators are the calcium indicators fura-2, indo-1, fluo-3, fluo-4, and calcium green. For sodium detection, SBFI (sodium-binding benzofurzanisophthalate) or sodium green are commonly used. In addition, PBFI (potassium-binding benzofurzanisophthalate) detects potassium ions.
Functional assays
“Functional assays” is the broad term used to cover standardized experiments to assess various functions that can be visualized with fluorescent markers. These markers can encompass, but are not limited to, any of the above-mentioned labeling techniques and fluorophores. For many of these functional assays, staining kits are available from ATTO-TEC and can be applied easily to a variety of specimens. These kits take advantage of polyclonal and monoclonal IgG antibodies or other proteins with ATTO dyes [3]. One example of a functional assay is the commonly known and widely used live/dead assay. Two fluorophores are utilized to label live cells and dead cells. Having both values at hand the overall health status of the cells can be assessed. Correlating this information with additional markers may even increase the understanding of any underlying processes.
What are the excitation and emission peaks for a fluorescent dye?
When using fluorescent dyes, it is critical to be aware of their excitation and emission wavelength peaks, solubility, quantum yield, brightness, and photostability. Depending on the specific application, the appropriates dyes should be used. A comprehensive list of fluorescent dyes, with their respective excitation and emission wavelength peaks, is in the table below (available as a pdf file). For the basic principles of fluorescence [5], like the Stokes shift relating to the difference in wavelength between the excitation and emission light of a fluorescent dye, readers can refer to reference 4. Please note that the peak is part of every dye’s distinct excitation and emission spectrum. When selecting several dyes to use together in one experiment, such as for multiplexing and spatial biology applications, researchers should be aware of overlapping excitation and emission spectra due to crosstalk or bleedthrough which can result in false negatives or positives or otherwise obscure data. Something else which can distort fluorescence imaging is autofluorescence from naturally occurring fluorescent proteins or biomolecules in cells and tissues. It especially needs to be taken into consideration for experiments with plants or algae. However, interference due to autofluorescence can be reduced if dyes with excitation wavelengths longer than 550 nm are used. A good understanding of dye spectra is also important, so that the optimal choice concerning the light source for excitation, e.g., LED, arc lamps, or laser lines, as well as the filters and detectors for emission is made. Examples of ATTO dye spectra [3] are shown in figure 6 below. Information and data concerning excitation and emission wavelength peaks, solubility, quantum yield, brightness, and photostability for ATTO dyes is available in reference 2.
 and ATTO 553H (yellow curve). The overlap of the two emissions spectra is clearly seen. The red line indicates the wavelength band pass of a 488 emission filter.")
Fig. 6: Fluorescence emission profile of ATTO 488 (green curve) and ATTO 553H (yellow curve). The overlap of the two emissions spectra is clearly seen. The red line indicates the wavelength band pass of a 488 emission filter.
, Tropomyosin (cardiomyocytes, red) and GFP (primordial cardiac layer, green).")