
Introduction
The Coral Life workflow provides a streamlined live-cell CLEM solution for getting insight about structural changes of cellular components over time.
Besides the technical handling described in the workflow manual, this article provides additional knowledge for a successful experimental run.
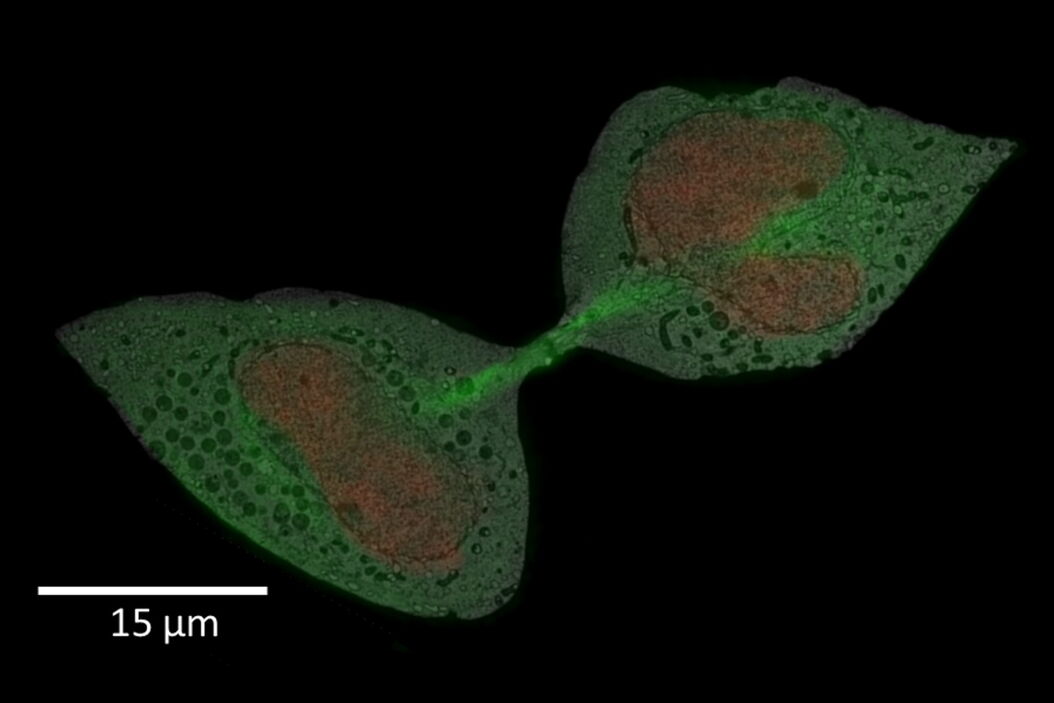
For this example, the main interest was the final separation of two mitotic cells, called abscission. After cytokinesis, the two dividing cells are only connected by an intercellular bridge which needs to be resolved. Because of its size, this mechanism can’t be fully understood by live-cell imaging. Therefore, the ultrastructural analysis is needed to understand the underlying mechanism of final cell separation.
Preparation of sapphires
The 6 mm sapphire disks need to be cleaned before the actual experiments. Cleaning is performed according to the following steps:
- In a fume hood place the sapphire disks in concentrated hydrochloric acid (HCl 30%) for 2 h.
- Wash the sapphire disks 3x for 5 min with doubly distilled (dd) H20.
- Let the sapphire disks dry on filter paper afterwards.
After the cleaning process, a finder grid pattern needs to be evaporated onto the clean sapphire disks. This step is critical! The pattern ensures easy retrieval of the sample position and regions of interests later in the resin block. Coating the sapphire with the pattern is performed as follows:
- Place a clean sapphire disk into each respective position of the coating mount and add a 6 mm finder mask on top (Fig. 1). The finder grid masks have a recess at the periphery which indicates the mask orientation. All masks shall have the same orientation to consistently indicate the correct orientation of the sapphires during the subsequent steps. It is recommended to place the finder grid in the orientation which produces readable letters.
- For evaporation of the mask, you can either use gold or carbon. Here, a carbon coating was applied with an EM ACE 600 carbon thread using pulse mode (double thread, 100 mm distance, 210 W, 150 ms pulse length). A carbon layer of 10 nm thickness was deposited onto
the sapphire.- Make sure to turn the rotation off. This will result in better clarity of the grid pattern.
- Depending on the coater and the application technique it may be necessary to apply a thicker carbon layer to obtain good visibility.
- If you use carbon, do not forget to stabilize the carbon layer at 180° C over night.
- The sapphires are now ready to be used for setting up the SampLink chambers as described in the workflow manual (Ref. Section 5.1). Make sure that the carbon layer faces the inside of the SampLink chamber. The cells need to be grown on top of the carbon layer.

Before seeding the cells into the assembled SampLink chambers, the chambers need to be cleaned again and sterilized. Perform the following steps in a cell culture hood:
- Fill the chamber with 1 ml 70% Ethanol and incubate for 5 min.
- Wash 3x with dd H2O.
- Let it dry overnight.
- UV sterilize it for at least 1 h.
The next day:
- Wash it 3x with PBS.
- Add 1 ml PBS or culture media and place the chamber in the incubator overnight.
- After incubation rinse it with dd H2O.
The chambers are now ready for use. Seed the cells either directly on the sapphire or on an additional polymer or polypeptide coating. Here, the sapphires were coated with Poly-L-Lysin (broid P1274, mol wt 70,000-150,000, Sigma-Aldrich) on top of the carbon grid pattern. Coating was performed with 0.1 mg/ml diluted in ddH2O. 50 μl were added onto each sapphire for 5 min, rinsed afterwards (3x ddH2O), and dried for 2 h in the hood.
Seeding of cells
For these experiments, a HeLa Kyoto HKF1, H2B-mCherry, alphaTubulin, mEGFP cell line cultivated and seeded in DMEM medium (10 % FCS , 1 % Penicillin/Streptomycin) was used.
- Per SampLink 66,000 cells were plated and incubated for 24 h at 37° C with 5% CO2.
- In a standard cell culture incubator place 6 open SampLinks into a 140 mm petri dish and close the petri dish. The SampLinks need to be assembled completely before the actual imaging experiment. To assemble the SampLink chamber, follow the description in section 5.2.4 of the Coral Life manual.
- If the SampLinks are incubated directly in the OxyGenie, the SampLinks chambers need to be assembled directly after seeding. Note: The OxyGenie needs around 30 min to heat up.
- During these experiments, a ~70% cell confluency was reached after 24 h incubation.
Live-cell imaging
Once your cells are at the desired confluency level 6 SampLink chambers can be safely transferred from the cell culture lab to the microscopy lab.
Once the THUNDER Imager with a SampLink chamber is in place for imaging, here are some tips and tricks on the imaging parameters:
 can easily be found by locating the letter I, J, O, P (arrow heads)")
found by locating the letter I, J, O, P (arrow heads).
- Set the transfer position of the stage so you can easily unload the SampLink chamber afterwards for freezing (see section 4.1 of the workflow manual).
- Generate an overview for orientation:
- Manually identify the sapphire center based on the grid pattern (see Fig. 2).
- Once identified, start a quick spiral scan from the center covering the complete area for an initial fast overview. This enables a quick check of the orientation. Here, the 40x water immersion objective was directly used.
- For further identification of interesting regions, a spiral scan with focus map was performed. The advantage is that the focus will be corrected if the sapphire or chamber are not completely flat. Tile scans with focus map can be created in multiple channels (Fig. 3). It is recommended to run the channels one by one and merge them after completion.
- After completion, identify your region of interest (ROI) as shown in Fig. 4. Using more than one ROI per sapphire is possible for downstream analysis. However, you must make sure that there is sufficient space between the regions to make room for trimming or splitting the resin block.
 transmitted light and B) fluorescence channel – illumination at 510 nm.")
In this example, the observation was started with cytokinesis onset. The sample was fixed 60 min afterwards. Depending on the dynamics of your process of interest, you need to choose different imaging intervals. For the purpose here, 1 image per minute was enough to follow cytokinesis and abscission.
 and alpha tubuline-mGFP (cytosol in green)")
A: Spiralscan creating an overview acquired with the 40x/1.1 NA sapphire-corrected objective. B: Region depicted by circle in A, magnified. The dividing cell of interest is in the center.
Freeze substitution and embedding
For this example, an en bloc freeze substitution protocol was used. This technique uses strong metal staining inside the sample for good contrast during SEM imaging. It also can be used for TEM imaging; however, it slightly reduces the resolution due to the strong metal accumulation on the lipids. At high magnification, the samples can appear fuzzy. The freeze substitution cocktail used contained 1% OsO4 + 0.2 % uranyl acetate + 2.5% H2O in dry acetone.
Samples were placed under liquid nitrogen in the freeze substitution cocktail and transferred into the pre-cooled EM AFS2 system at -90° C. The following freeze substitution protocol was used:
- Freeze substitution:
- -90° C for 48 h in the freeze substitution cocktail
- Slope 5° C/h until -30° C
- Maintain -30° C for 4h
- Slope 5° C/h until 20° C
- Maintain 20° C for 5 h
- Contrasting:
- Wash 3 x 10 min in acetone
- 1% thiocarohydrazide in acetone at RT for 20 min
- Wash 3 x 10 min in acetone
- 2% osmium tetroxide in acetone at RT for 20 min
- Wash 3 x 10 min in acetone
- 2% uranyl acetate in acetone at 60° C for 20 min
- Wash 3 x 10 min in acetone
- Infiltration:
- 30% Durcupan in acetone for 3 h
- 70% Durcupan in acetone for 3 h
- 100% Durcupan for 3 h
- 100% Durcupan overnight
- 100% Durcupan for 3 h
- Polymerization for 48 h at 60 °C
After embedding is complete, place the flow-through rings (16707161) in the reagent bath (16700154) and fill it halfway with fresh resin. Transfer the sapphire into the flow-through rings and check the readability of the finder grid using a stereo microscope (Fig. 5). Afterwards, fill the flow-through rings completely and place the samples in an oven at 60° C for 48 h.
Sample retrieval and sectioning
One of the most critical steps in the workflow is the retrieval of the ROI in the resin block and the subsequent trimming and imaging. To check if the samples are well preserved and present, a quick imaging of the block face of the resin block after polymerization is recommended. For this experiment, the data from the light microscope was correlated with the image from the block face in the following way:
- After breaking the samples out of the polymerized flow-through ring, the residual thin layer of resin was scratched with a scalpel off the back side of the sapphire
- Residual debris was removed with a tissue wetted with ethanol
- The sample block was positioned with metal clamps on the THUNDER Imager stage and was held so that the sapphire was (nearly) perpendicular to the optical axis of the microscope
- Transmission illumination through the resin block could be used for imaging
- Alternatively, autofluorescence of the resin block under blue light (470 nm) could be used for “back illumination” of the cells
- The block was first localized using a spiral scan
- Then both a focus map with 5 focus points and an image scan of the whole block face were created
- The scan was merged with an overview image and exported as a tiff and jpg file
- The jpg files could be overlaid at the correct magnification onto the live-cell images by the imaging tools of Microsoft Office; more sophisticated overlay procedures can be done using the tiff files and Fiji software

Note: It is normal that single cells or sometimes cell batches can detach from the sapphire during high-pressure freezing. High confluency or cells that are not strongly bound to the substrate (i.e., mitotic cells, because they round up and, therefore, the attachment points to the substrate get reduced) promote this effect. Using lower cell densities and/or different types and concentrations of coatings can reduce the loss of cells during vitrification.
Afterwards detach the sapphire from the block face:
- Start by trimming away the excessive resin around the sapphire. This can be done with a heavy razor blade.
- Heat up the EM MP system (16705403) and prepare a small Dewar with LN2.
- Use a pair of tweezers to hold the resin block.
- Place the block face down on the hot EM MP for 10-20 sec.
- Then dip the block face directly into the liquid nitrogen to cool down. You will hear a cracking sound.
- While looking through the stereo microscope, insert a sharp razor blade between the resin and sapphire. The sapphire should detach easily from the resin. If not, repeat the heating/cooling step.
- When the sapphire is removed, you should still be able to observe the carbon pattern on the block.
Utilizing the finder grid pattern, you can locate your ROI on the block and trim it down. Here, the EM TRIM2 was used for trimming of the block.
For this example, it was important to do serial sectioning, as only 5-7 sections contained the target feature. Therefore, the sections were mounted on slot grids. Because an en bloc freeze substitution and infiltration protocol were used, no post staining was necessary.


Data postprocessing
For this experiment, the raw data was postprocessed using the THUNDER technology. To learn more about THUNDER and how you can use it for postprocessing and targeting inside the Coral Life workflow, check out the application note: “How to improve live-cell imaging with Coral Life”.
 Standard WF Image of cells of interest, imaged with green and red fluorescence channels. B) Data post-processed with THUNDER Small Volume Computational Clearing.")
Clearing.
Image correlation
Final image correlation depends on the requirements of each individual experiment and can vary from just placing the different image results side by side to more detailed image correlations in 2D and 3D which can extract the relationship between ultrastructure and live cell data. For this example, an overlay of the LM and EM data was created. For a matching overlay, landmarks needed to be placed on the light and electron microscope images. To do this, mostly a non-ridged deformation of the overlaying images is necessary.


 labeled with membrane-permeable calcein, high-pressure frozen in salt water using EM ICE.")
