
What to expect in the Whitepaper
Key Learnings
LIGHTNING super-resolution under cryo conditions
- How does it work?
- Deconvolution is well known, but what is special about LIGHTNING?
- How does LIGHTNING improve the targeting precision with the STELLARIS Cryo confocal microscope?
- Can I quantify my data after deconvolution with LIGHTNING?
TauSense under cryo conditions
- What is TauSense?
- How does TauSense work?
- TauContrast
- TauScan
- TauSeparation
- TauGating
- Fully integrated into the Coral Cryo software workflow
Introduction
Cryo electron tomography (cryo-ET) is a transmission electron microscopy (TEM) technique dedicated to the imaging of relatively thin volumes (about 200-300 nm thick) using a tilt series. With this technique, the 3D molecular structure of proteins can be revealed.
With the technological advances of the last decade regarding sample preparation using cryo-FIB and cryo-TEM, another milestone was achieved. Hence, the structure of proteins and other biomolecules can now be resolved using cryo-ET in their native environment, inside the cells, with sub-nanometer resolution. For this approach, cells are grown on a TEM grid, vitrified by plunge freezing, and then transferred to a cryo-FIB/SEM to produce a small window (lamella). The lamella can then be imaged in a tilt series with cryo-TEM. The imaged window of the cells must be thin enough to allow the electrons to pass through the sample.
However, to identify target sites in samples, high precision for localization of regions of interest is required. Currently, this is done mainly by cryo-confocal fluorescence microscopy, enabling high precision imaging in 3D. The confocal pinhole eliminates the out-of-focus light, increasing resolution and contrast, particularly in the axial direction.
In the following, it is explained how the LIGHTNING super-resolution technique and TauSense fluorescence lifetime-based tools are used under cryogenic conditions to enable better discrimination and identification of structures of interest with fluorescence microscopy which is performed for subsequent EM steps.
LIGHTNING super-resolution under cryo conditions
How does it work?
Although confocal microscopes provide an extremely good 3D-scanning quality, diffraction phenomena still occur during imaging and resolution is normally diffraction limited. These are characteristic for each imaging system setting and can be described as so-called Point Spread Function (PSF). The resulting image is a convolution (folding) of the sample with the PSF of the imaging system and conditions used. The diffraction phenomena produce a blurry image of the sample resulting in a reduction of the effective resolution and an incorrect mapping of the exact photon positions. Other interfering signals, such as background and noise, are also present and have an effect on the information available from the raw data.
Nevertheless, it is now possible to identify interfering signals of individual photons from out-of-focus regions of the sample via sophisticated models and then deconvolve them by correlation with their original location. The result of this approach is super-resolution imaging.
Deconvolution is well known, but what is special about LIGHTNING?
Traditional deconvolution methods for confocal microscopy often use one global setting for the image reconstruction which does not consider inhomogeneities in the image. Consequently, signals that are carrying information could be rejected while unwanted signals, like background or noise, could be wrongly interpreted as information.
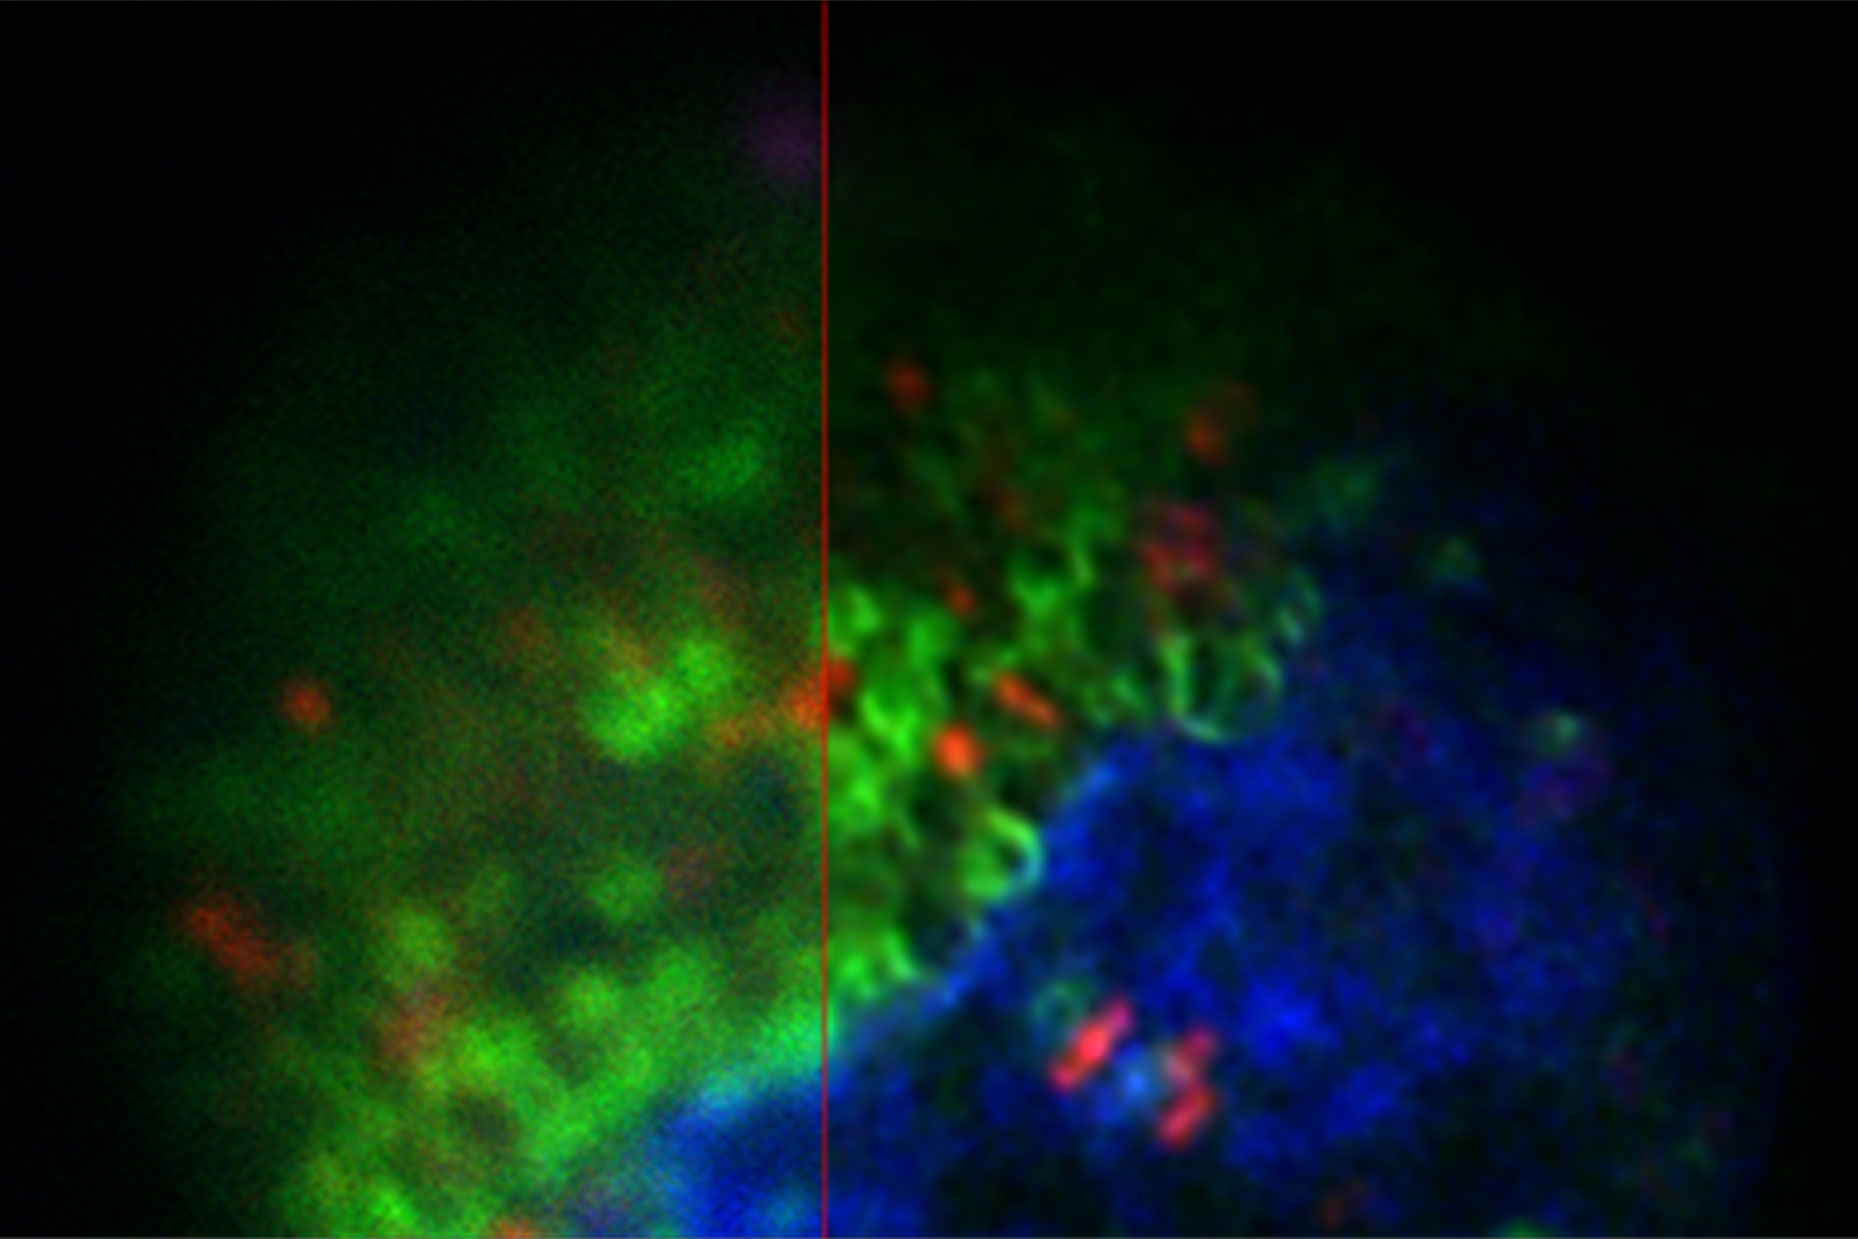
LIGHTNING, on the other hand, includes location-dependent, voxel-precise differences. This adaptive process enables a fully automated and accurate recovery of information for any biological sample, even when imaged under cryogenic conditions (Figure 1).

LIGHTNING improves the image quality by removing unwanted background signals and noise. In the pre-processing step, before the actual deconvolution, a global background value is determined. The global background is fine-tuned towards a local background value that is based on the ratio between the actual local signal and noise. Noise can be identified by its high spatial frequency and, therefore, be disregarded in favor of signals carrying useful information.

The images in figure 2 show two representative cancer cells taken with standard confocal microscopy (upper images) and LIGHTNING super-resolution confocal (lower images), displaying mitochondria (green), lipid droplets (red), and nuclei (blue). It is clearly seen that the background and noise are removed by LIGHTNING and the structures are easier to recognize and discriminate due to the higher contrast. The clear improvement in image quality makes it easier to identify target structures for the subsequent correlative steps.
The effect of LIGHTNING is even more pronounced when imaging at a higher magnification, as seen in the zoomed-in regions of interest shown in figure 2.
Looking at lipid droplets in region 1, the signal is improved by LIGHTNING, background and noise are reduced, and the lipid droplet shown can be targeted more precisely.
The same can be observed with the more tubular structure seen in region 2. LIGHTNING improves the contrast of the mitochondrial membrane, making the tubular appearance more clear, and not only increases the targeting efficiency, but also the precision of CLEM overlays for correlative processes.
Can I quantify my data after deconvolution with LIGHTNING?
Yes. The process for generating the Decision Mask is based on generic image processing methods and is, therefore, fully quantifiable. No intensity or localization-based characteristics of individual photons or photon counts are changed. This process only extracts existing information from the confocal data and does not make any modification.
Regardless of the use of an adaptive approach, no local and, thus, relative intensities are distorted during reconstruction. By using the adaptive, Decision-Mask-based approach, the probability of generating artifacts or excluding information is reduced to a minimum.


Fig. 3: Projection of a confocal z-stack. Sum159 cells, human breast cancer cells provided by Ievgeniia Zagoriy, Mahamid Group, EMBL Heidelberg, Germany. Blue–Hoechst - indicates nuclei, Green–MitoTracker mitochondria, and red–Bodipy - lipid droplets
TauSense under cryo conditions
What is TauSense?
TauSense is a tool set that exploits fluorescence lifetime-based information. Therefore, it provides additional information for understanding cellular functions. Furthermore, TauSense can improve image quality and extends the capability to discriminate fluorophores in a given specimen. TauSense can be applied at room temperature and for vitrified samples.
How does TauSense work?
An intrinsic phenomenon of the fluorescence process is the specific time between the excitation of the fluorophore and its photon emission. A pulsed laser is used to excite the fluorophores in a sample and the photon arrival time at the detector is measured (Fig. 4).

This time interval is known as fluorescence lifetime. Fluorescence lifetime depends on both the fluorophore and its microenvironment. The ability to separate the contributions from the two (or more) fluorescence sources, makes TauSense a powerful analysis tool for life sciences. With TauSense, the arrival time of the photons is determined and exploited as an extra dimension that allows microenviromental changes to be observed and the multiplexing of fluorophores.
TauContrast
TauSense calculates the average arrival time (AAT) at each individual pixel and displays it as another dimension by different colors which are in addition to the standard intensity image. TauContrast has a specific look-up table (LUT; Figure 5).

Samples courtesy of Nicole Poulsen, B CUBE, TU Dresden, Germany.
Shorter AATs are shown in the blue range and longer values in the red spectrum. Hence, it is possible to intuitively discriminate different AATs immediately. Typically, reflections and some types of autofluorescence are represented by “shorter” AATs below 1 ns, while target signals created by fluorescent proteins are in the “longer” range above 1 ns. This fact enables the discrimination, separation, and removal of components in the image which disturb the targeting process for the following correlative EM steps.
TauScan
To identify and discriminate potential different lifetime components, i.e., different labels in the specimen, it is possible to use the lifetime-based distributions. Using TauScan, these distributions can be scanned and separated into a predetermined number of temporal windows (Fig. 6).
Digitally preset gates followed by a multi-exponential component fit is used to generate an online view (Fig. 6, bottom) of the arrival-time distribution for such lifetime components. This distribution enables one to work with the arrival time information in way which is analogous to that for a spectral distribution of a fluorescence signal.
Here, the temporal dispersion of the signal is obtained and then by positioning the appropriate temporal windows the photon signal can be split according to the arrival time information contained in the photon flux. After such splitting of the signal, the spatial coding of the photons leads to the corresponding images. The images that result from a TauScan experiment are intensity images containing discrete temporal information (the temporal windows as explained above) across the lifetime component distribution.

TauSeparation
TauSeparation uses the distribution for lifetime components, like in TauScan, to separate fluorescence species in the sample. The user decides on the values of the most representative mean lifetime components with the aid of an online diagram. Then TauSeparation selects appropriate temporal windows and displays the components in separate images (Fig. 7). In this way, even fluorophores which cannot be discriminated by their spectral properties can be separated and intuitively discerned by different look-up-table colors. Hence, also target structures for electron microscopy can be effectively discriminated, increasing the reliability of correlative workflows.

TauGating
In addition to the separation of components, one can exclude particular temporal ranges from being displayed, so that the target signal can be further distinguished from unwanted contributions (Fig. 8).
For electron microscopy workflows and, in particular, cryo applications on grids, sometimes autofluorescence and reflections in relation to the carbon layer or just the sample support can be observed. Applying TauGating to the relevant channel cleans up the target fluorescence signals and, as a result, increases the precision of the targeting process for downstream processes like FIB milling.

Fully integrated into the Coral Cryo software workflow
Both modalities, LIGHTNING and TauSense, are fully integrated into the software workflow for cryo applications which is called the Coral Cryo workflow (Fig. 9).

For LIGHTNING, a wizard is provided which guides users on how to define suitable settings according to their needs (for example, higher acquisition speed versus higher resolution). Interdependent parameters are automatically set to meet the intended attribution for quality.
All TauSense tools are intuitively embedded into the detector settings and can be activated by 2 mouse clicks (Fig. 9).

Summary
LIGHTNING and TauSense are tools which help users increase image quality and improve the information content of the image data. LIGHTNING enhances the resolution attained under cryo conditions and TauSense helps users separate the target fluorescence signals from those of other fluorophores or even unwanted ones, such as autofluorescence and/or reflections. Both tools enable users performing cryo workflows to identify target structures within vitrified samples more reliably and accurately, particularly for cryo electron tomography.
Download
Click here to download the whitepaper as pdf.
 labeled with membrane-permeable calcein, high-pressure frozen in salt water using EM ICE.")


