
Introduction
Steel is one of the most important metallic alloys in the world today. Consequently, steel alloy production is an essential part of the global industrial infrastructure. With over 2,500 varieties of alloy and a broad range of properties, new steel grades are being developed for new, more demanding products and applications.
Steel production runs through several steps: the extraction of iron ore from rock, the smelting of the ore to obtain base iron, and the use of the oxygen convertor process to convert carbon-rich pig iron into steel [1,2]. It has been known since many years that the steel microstructure (inclusions, grains, precipitates, and other phases) has a large influence on the alloy properties and quality [1,3-6]. For steel manufacturers to remain competitive in a global market, they must use materials analysis to assess accurately steel quality. Knowing the quality of steel is important for many types of products and applications, e.g., new alloys, vehicles, buildings, ships, pipelines, and recycling.
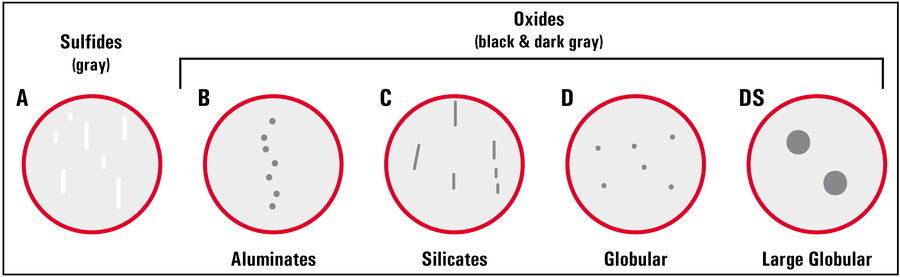
Typically, steel inclusions are classified by imaging with optical microscopy having sophisticated analytical software which then classify them according to standard characteristics (refer to figure 1) in terms of dimensions, color/shade, shape, and arrangement [3,5-6]. However, the composition, i.e. oxides, sulfides, silicates, nitrides, etc., also matters. Furthermore, global networking of industrial materials has forced manufacturers to make readily available the property and specification data of their steel alloys, so they can be easily compared to established regional and international standards.
Steel quality: Non-Metallic Inclusion (NMI) analysis
Analysis of steel NMIs to determine quality is often done during alloy production and failure analysis. In the past, the NMI rating was done manually by comparing images to standard charts. This approach is time consuming and the results are significantly influenced by the judgement of the user. Today visual examination of polished steel is performed with a microscope system having image analysis software that automatically scans the sample, detects the defined inclusions, displays the raw data, and classifies the inclusions according to national and international standards [3,5-6]. For a more reliable determination of steel quality, having both image and composition data of the microstructure would be advantageous. However, elemental/chemical analysis methods, such as energy dispersive x-ray spectroscopy (EDS) performed with scanning electron microscopy (SEM), can be costly and time consuming [7,8].
2-Methods-in-1 solution
In most cases, accurate, reliable data for rating steel quality based upon its inclusions (Fig. 1) are critical for making confident decisions, despite limited time and budget. A 2-in-1 solution delivers precise, reliable visual and chemical analysis in one instrument [7,9]. The fact that less sample preparation is needed compared to SEM/EDS, there is no sample transfer from one system to another, and the sample is analyzed in air leads to time and cost savings when doing NMI analysis in steel.
An example of such a solution is described in this report, the DM6 M LIBS materials analysis system with the Steel Expert software from Leica Microsystems. It combines optical microscopy (visual analysis), laser induced breakdown spectroscopy or LIBS [1-2,8] (chemical analysis), and software specialized for rating steel NMIs [3], including comparison with established standards [3,5-6], such as ASTM E45, ISO 4967, DIN 50602, etc. Advantages of a 2-in-1 solution for steel are described below.
Steel NMI analysis
Visual examination
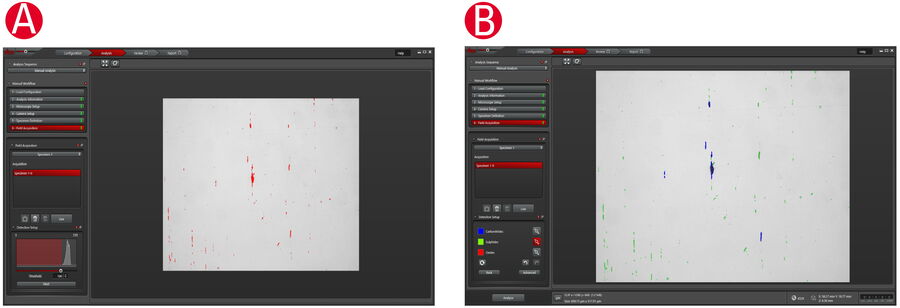
Different types of inclusions in steel alloys can be rated with specialized software. Inclusions are most often classified by gray value/color, size, shape and geometrical arrangement. Their composition can also be determined. The properties of most inclusions are shown in table 1 below. Depending on the number and size of the different inclusions, a quality rating is generated for the steel sample. An example of an inclusion rating with the Steel Expert software is shown in figure 2.
| Inclusion Type | |||||
Analysis | Property | Globular Oxide | Aluminate | Silicate | Sulfide | Carbonitrides |
Visual | Shape | round | round | elongated | elongated | irregular |
Grouping | single | >2 | Single or group | single or group | single or group | |
Color/Shade | black | black | black | gray | depends on composition | |
Chemical | Composition | Ca, Mg, O, etc. | Al, O | Si, O | Mn, S, etc. | Ti, Co, C, N |
Table 1: Overview of common non-metallic inclusions in steel and their basic properties.
Chemical/elemental analysis
Nevertheless, very often the analytical workflow is not finished after visual classification. Different types of inclusions can look very similar in color or shade of gray and differ significantly in composition. Oxide inclusions are black or dark gray and can be composed of iron (Fe), manganese (Mn), aluminum (Al) [aluminates], calcium (Ca), chromium (Cr), silicon (Si) [silicates], among other elements [3,5-6].
Sulfide inclusions are light gray and can be composed of Fe, Mn, Ca, magnesium (Mg), and other elements [3,5-6].
Nitride inclusions can have various colors and be composed of titanium (Ti), Al, carbon (C), oxygen (O), among other elements [3,5-6]. For instance, titanium nitride (TiN) inclusions are yellowish pink with a low amount of O, but become yellowish orange as O increases [3,10,11].
With large amounts of O and C, the TiN inclusions become dark blue or black [11]. The composition data is useful for understanding the result of the steel production process as well as determining the final steel quality.
Obtaining composition information requires an additional analytical technique which implies more sample preparation, transfer of the sample between instruments, and then relocating the region of interest. Thus, the result is a more complex, longer workflow.
Results
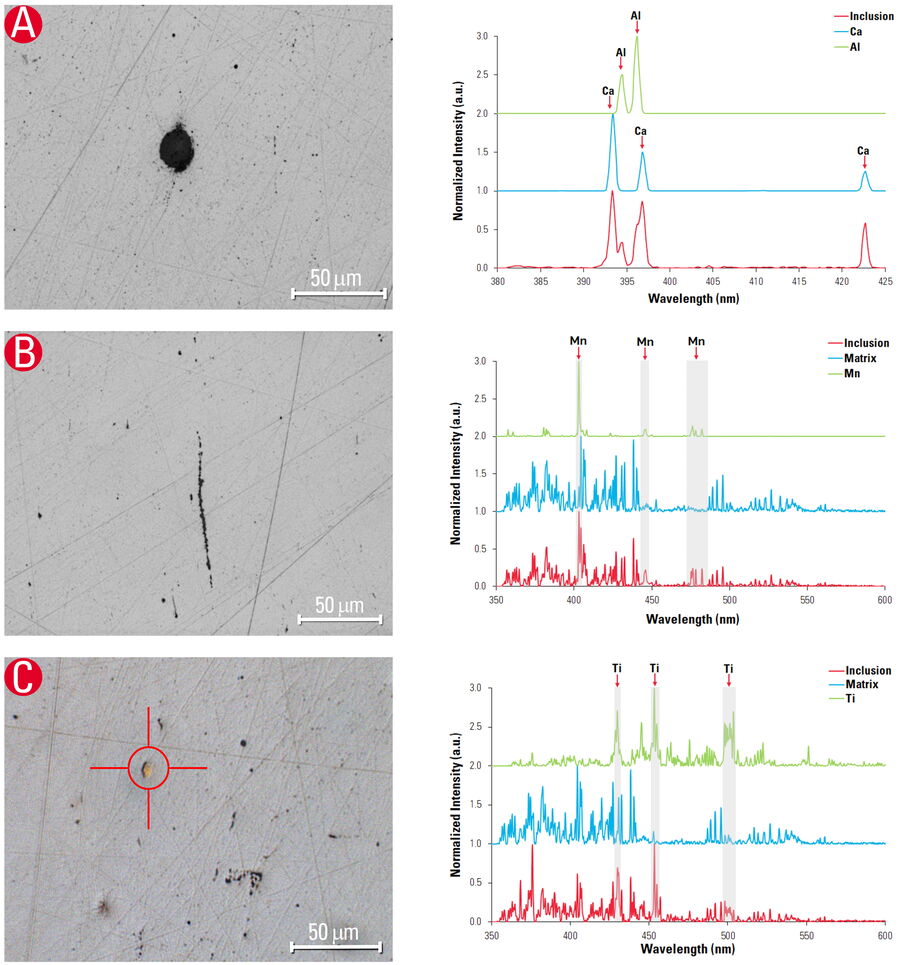
Simultaneous visual and chemical analysis of steel inclusions was done with the 2-in-1 solution from Leica Microsystems. Images of steel inclusions with their composition, rapidly analyzed using LIBS, are shown in figure 3.
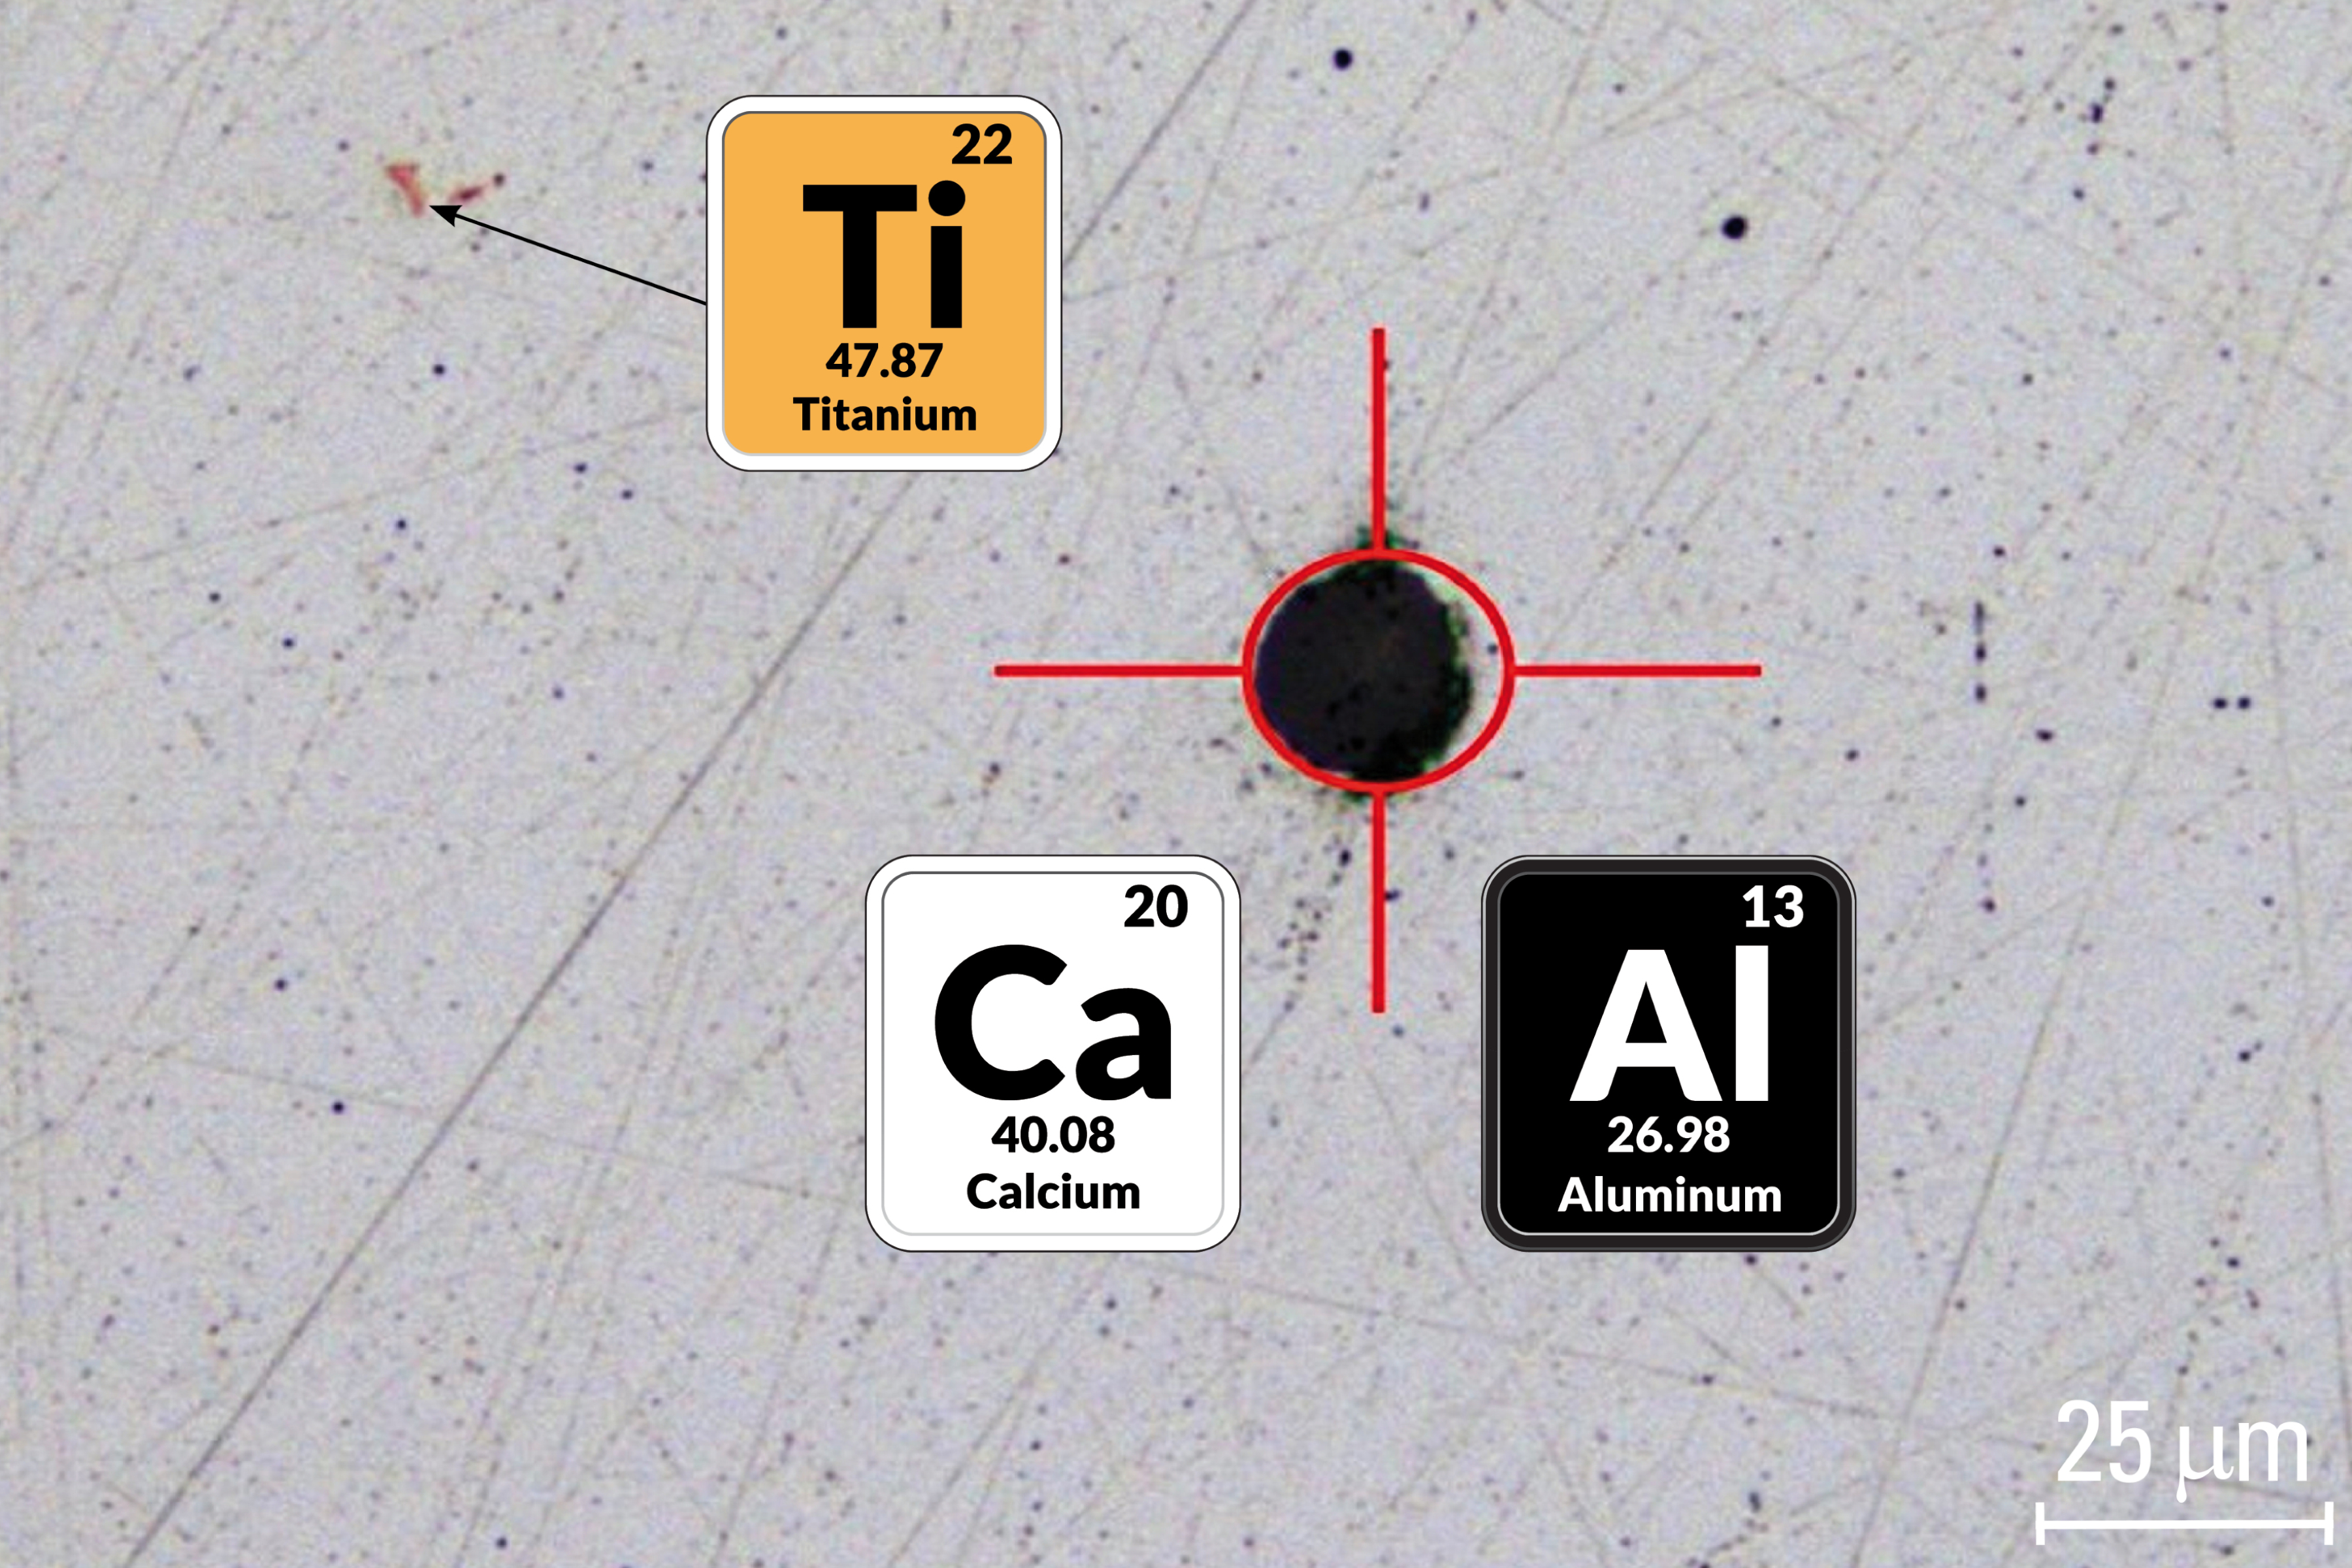
Figure 3 illustrates how NMIs are analyzed in a straightforward way using the combined approach of visual and chemical analysis (microscopy and LIBS). Figure 3A shows an inclusion whose size exceeds that of the laser beam. Its composition is directly revealed by basic analysis using the spectra database. In the presented case, Ca and Al were identified as the main NMI components. With information from the visual inspection, the inclusion can be identified as a Ca-Al oxide. Small and fine NMIs, as seen in figure 3B and 3C, are analyzed by comparing their LIBS spectra to that of the steel matrix. Differences in characteristic elemental signals reveal the chemical composition of the NMIs. The string-like inclusion seen in figure 3B has mainly Mn.
The small orange inclusion in figure 3C contains Ti.
Summary and conclusion
In this report, the advantages of a 2-methods-in-1 solution, which combines optical microscopy and laser induced breakdown spectroscopy (LIBS), for an efficient workflow when analyzing steel microstructure (inclusions and intermetallic particles) were presented.
Steel inclusion analysis is important for determining the quality of steel. It is frequently used for quality control during production and failure analysis. Often the time and expense allocated for such analysis is limited, but obtaining reliable results and achieving the desired steel quality always remains a goal.
A 2-in-1 solution for steel inclusion analysis delivers visual and chemical analysis in one instrument. An example is the DM6 M LIBS system running the Steel Expert software from Leica Microsystems.
It offers accurate, rapid visual and chemical analysis in one instrument, reduces sample preparation, eliminates sample transfer, and does not require the sample to be in vacuum. These advantages enable users to perform fast, precise, and more economical steel inclusion analysis.


