
Introduction
Understanding the intricate architecture of biological tissues and materials at the nanoscale requires more than just high-resolution imaging—it demands three-dimensional context. This is where volume-scanning electron microscopy (volume-SEM) becomes indispensable. By enabling the sequential imaging of ultrathin sections, volume-SEM allows researchers to reconstruct detailed 3D models of cellular and subcellular structures, which is critical in fields such as cell biology, neuroscience and cancer research.
Yet, even with high-quality image acquisition, the challenge of interpreting large volumes of data remains. This is where AI-driven image segmentation plays a transformative role. In this article we show an exemplary workflow from embedding a biological sample up to AI-supported image segmentation and analysis.
Results
The parasitic protozoan Trichomonas was selected as a specimen (Figure 1). This organism is clinically relevant, as it causes Trichomoniasis, a sexually transmitted infection. It is an oval to pear-shaped anaerobic, flagellated, motile protozoan with a size of about 10-20 micrometers in length having 4 anterior flagella and an undulating membrane stabilized by the costa, which helps in its characteristic erratic motility.

Sample preparation
Mouse caecum gut contents were extracted, and samples were fixed overnight in glutaraldehyde and subsequently processed using the OTO method (osmium–thiocarbohydrazide–osmium). During the osmium steps, osmium tetroxide was reduced using potassium ferrocyanide to enhance contrast and facilitate differentiation of membrane structures and organelles. Post-fixation staining was performed with uranyl acetate and lead aspartate. The samples were then dehydrated through a graded ethanol series and embedded in Araldite resin. This en bloc embedding method provides sufficient contrast during imaging without requiring additional post staining.
Trimming
The sample resin block was first manually pre-trimmed using a razor blade. A 250 × 250 µm block face was then automatically trimmed using the 2D Auto-Trim function of the UC Enuity. This process involves defining two corners of the target block face, guided by the software’s workflow. Based on the user-defined dimensions, the system performs the trimming automatically. Regardless of the trimming depth or the type of knife used (90° or 45°), UC Enuity accurately calculates the optimal knife positions to achieve the specified block face dimensions.
Serial sectioning
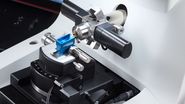
For the serial sectioning a diamond knife with a water bath hosting a 12 by 12 mm silicon wafer was used (Figure 2).

Note that a dedicated AT-4 knife by Leica Microsystems allows to perform an automatic alignment of the knife over the full length. This enables even less experienced users to create series of sections.
Ribbons for array tomography were taken using the guided volume EM workflow on the UC Enuity (Figure 3).

In the software workflow the user is guided to define three parameters:
- The positions of the ribbons on the knife in xy direction
- The number of sections per ribbon
- The number and thickness of release sections
Afterwards the sectioning can be carried out without user interaction. The ribbons are created and released at the end of the whole sectioning process by thicker release sections. These release sections are necessary to detach the ribbons easier from the knife edge for positioning on the wafer. The automatic creation of the release sections is only possible by the exact motorized restoring of each of the sectioning positions on the knife.
Scanning electron microscopy
Sections were imaged with a JEOL IT800SHL SEM using a dedicated AT software to adhere to the order of the sections for 3D reconstruction. From a total of 80 sections, #6-64 were used for reconstruction ending up with a total thickness of 5.44 µm. Three exemplary sections with prominent organelles are shown below (Figure 4).
Left: The costa underlines and is bound to the undulating membrane. Parasite movement depends on active changes in the configuration of the costa. Hydrogenosomes are membrane-coated spherical organelles with a diameter 0.5 µm, located near the costa.
Center: Four anterior flagella help to put Trichomonas in motion. The axostyle is a structure built of microtubules that runs from the nucleus to the posterior part of the cell forming a narrow tube. It participates in locomotion and cell adhesion of the parasite.
Right: The undulating membrane in protozoa organisms is a fin-like structure that enhances mobility in viscous fluids. Lysosomes are membrane-coated spherical organelles containing digestive enzymes. They are involved in various cellular break-down processes.

AI-Driven Segmentation
After image acquisition, researchers are faced with the daunting task of identifying and labeling structures across thousands of serial images. Manual segmentation is not only time-consuming but also subject to human bias and inconsistency. AI-based segmentation algorithms, especially those using deep learning (DL), offer a powerful solution.
Here, Leica Microsystems’ image analysis and visualization software Aivia was used to segment organelles within the 3D SEM data of the Trichomonas specimen. Aivia uses deep learning algorithms to enhance, segment, and predict features in 2D and 3D images, making it easier to extract meaningful insights without extensive manual effort.
Ground truth annotations for deep learning model training
To create the “ground truth” for automatic detection and segmentation of different structures, i.e. organelles within the Trichomonas specimen, they had to be first annotated with the correct label. The annotations can be done in 2D on individual Z-planes, or in the 3D volume. To provide sufficient information for deep learning model training, a minimum of two Z-planes with all objects of the same type (i.e. whole organism) annotated is required.
The annotations were exported as a binary mask and paired with the corresponding Z-plane as raw input files to the Deep Learning Processor in Aivia to train the deep learning model.
Once trained, the model can be reused and applied to similarly prepared image stacks, hence automatically finding the trained structures saving valuable time in comparison to manual annotation and segmentation of all images. The initial segmentation revealed features unique to the Trichomonas specimen (Fig. 5, left), such as the undulating membrane and sections of the anterior flagella.

Nevertheless, training a model with sparse data presents a challenge for accurate segmentation of the whole specimen. The automatic segmentation results can be complemented by manually editing the object in 3D using the Mesh Contour Editor (see video 1).
Video 1: Semi-automated, predictive 3D segmentation of hydrogenosome using the Mesh Contour Editor. Hydrogenosome is idenitifed on a Z-plane and traced using the Mesh Contour Editor, the trace is automatically filled in and the segmentation of the hydrogensome on the next plane is predicted by Aivia based on the prior plane. The prediction can be edited to further refine the shape of the predicting object in the following planes, enabling faster object reconstruction to the fully manual methods.
The tool leverages the user’s annotation of a structure of interest on the current Z-section to predict the structure on the next Z-section. Through edits on successive planes, it was possible to recover the missing anterior flagella and the posterior protruding recurrent flagella in the initial segmentation result and reconstruct the whole organism.
Reconstruction and final segmentation of subcellular structures and organelles
The principle underpinning annotations and manual edits of the whole organism could be applied to subcellular structures as well. Video 2 illustrates the process of applying predictive mesh editing to reconstruct the ER.
Video 2: Predictive segmentation of an ER object using the Mesh Contour Editor of Aivia. Initial segmentation is drawn by hand on the image. Aivia used the drawn region to predict the location of ER on the next Z-plane. Further edits allow Aivia to predict the ER more accurately and enabling faster object editing.
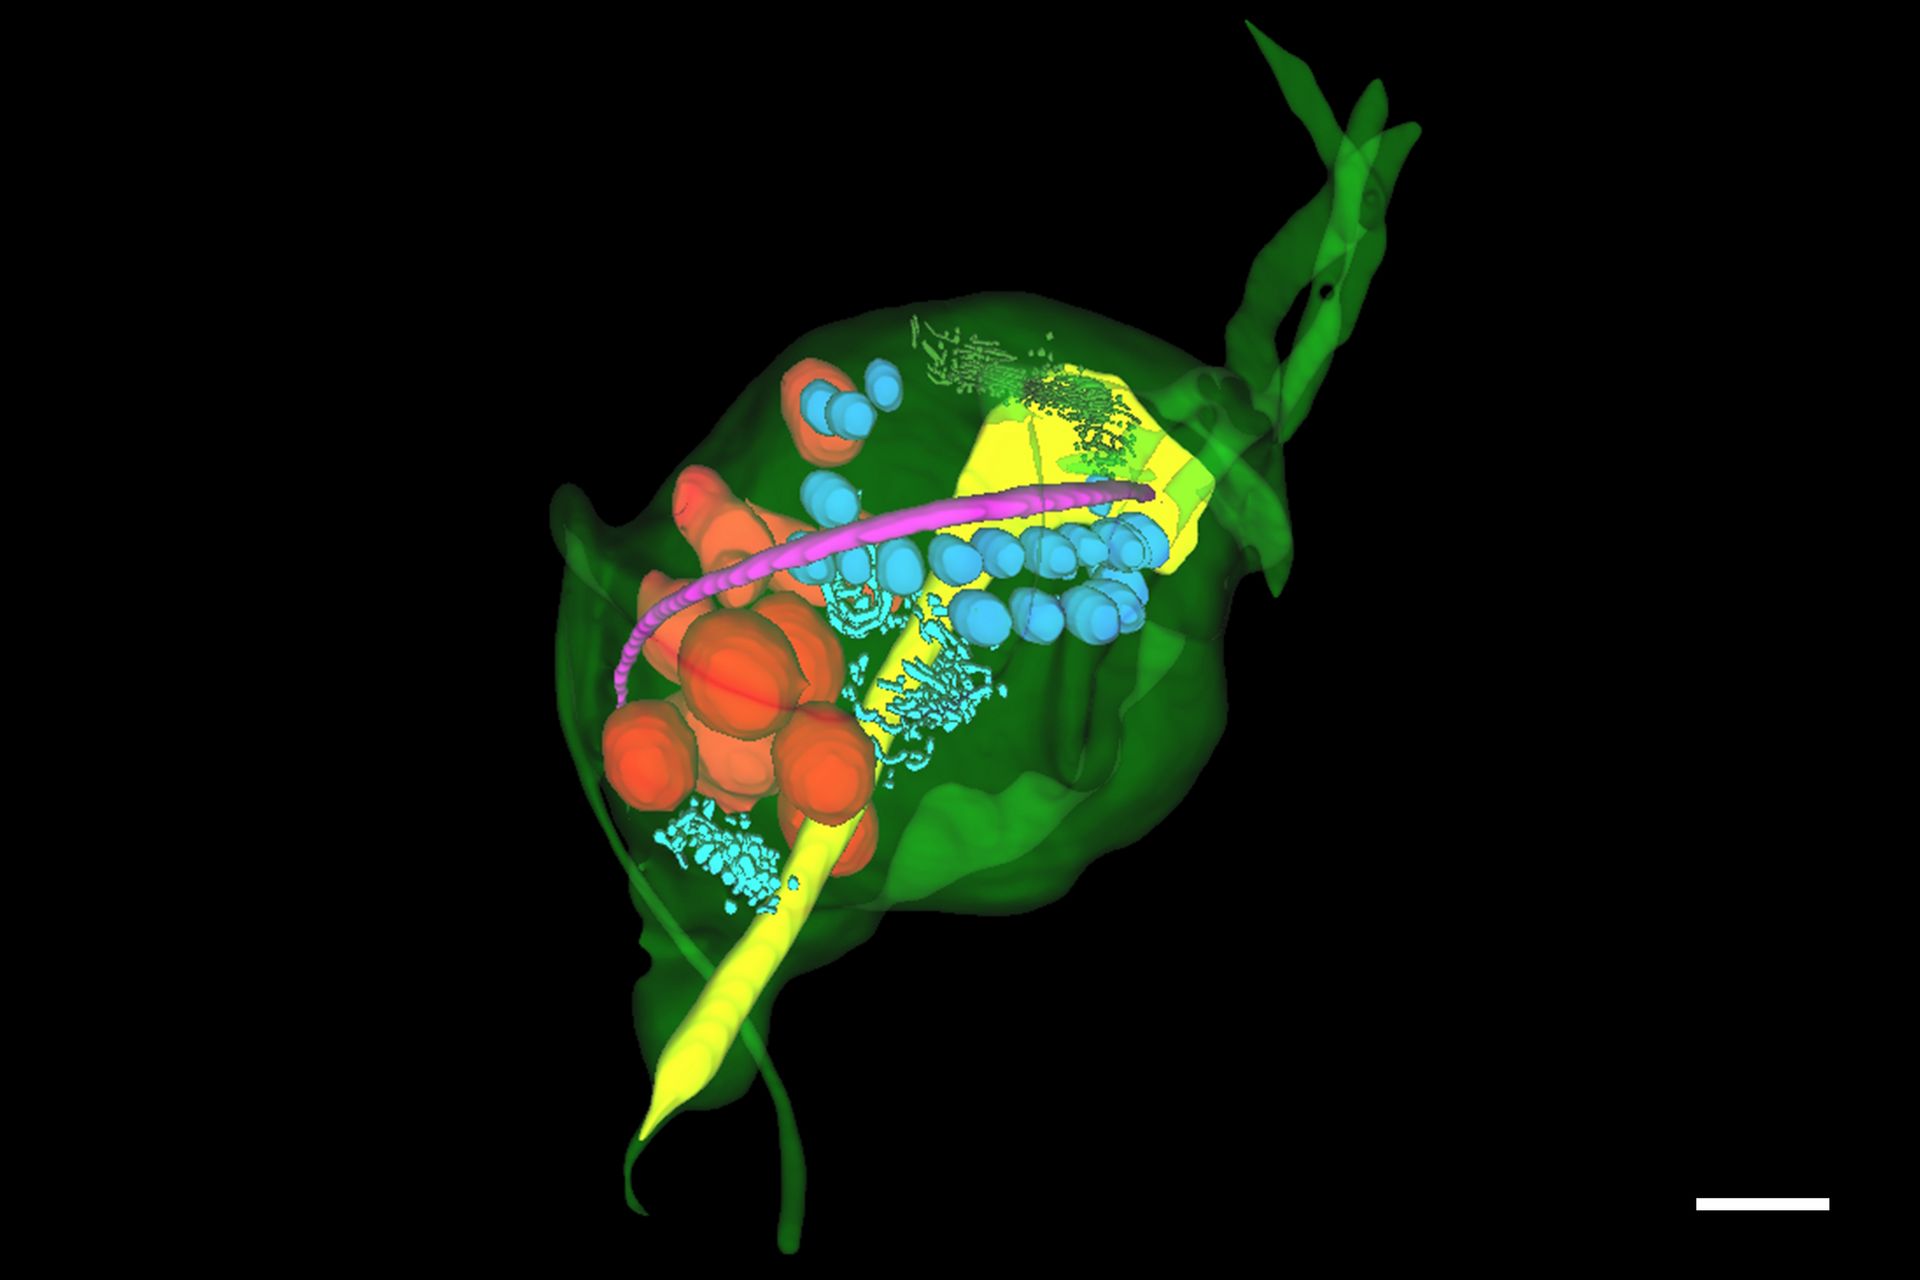
The unique appearance of the ER could be identified by the predictive tool with ease and the predictions could be refined in the editor to rapidly segment whole objects. The segmented objects could be exported for training new deep learning models to detect other objects on the image stack. The same process was applied to reconstruct other objects of interest in the specimen – including nucleus, costa, lysosomes, axostyle and Golgi – producing a full reconstruction of the trichomonas specimen and its key organelles (Figure 6).

Quantitative Analysis
After the segmentation was performed, advanced analysis in Aivia could be applied, allowing researchers to uncover deeper insights from the 3D dataset.
First, the total volume of five organelles – hydrogenosomes, endosomes, lysosomes, ER, and Golgi was measured and analyzed (Figure 7).

Quantitative Analysis
As the image resolution is insufficient to separate individual ER or Golgi objects, we opted to compare the total volume of these five organelles (Figure 8) and omitted ER and Golgi from the mean volume analysis (Figure 8).

Although hydrogenosomes comprised of almost half (1.33 µm3) the total volume of either endosomes (3.00 µm3) or lysosomes (3.28 µm3), the average volume of each hydrogenosome is significantly smaller (0.053 µm3 ± 0.014 µm3) than individual endosomes (0.50 µm3 ± 0.24 µm3) and lysosomes (0.66 µm3 ± 0.16 µm3).
Furthermore, the distribution of smaller ER and Golgi were examined (Figure 9). There are distinct volume distribution profiles between the two, with ER showing a broader distribution of sizes. The exclusion of larger ER and Golgi objects enabled the analysis of individual objects more effectively.

Hydrogenosomes are often found near the costa in trichomonas and are typically associated with other paracostal features such as the axostyle. Using the Spatial Relations tool in Aivia, the distance between the hydrogenosomes and other landmark structures – costa, axostyle, and the nucleus was measured. Afterwards the relationship between hydrogenosome morphology and proximity to these structures was plotted (Figure 10).

Overall, there was a limited anti-correlation between the size of the hydrogenosomes and distance to the costa (r = -0.17) and the nucleus (r = -0.38) and minor correlation between the volume and its distance to the axostyle (r = 0.34). As hydrogenosome morphology has been observed to change in response to oxidative stress, correlation between the morphology and spatial relations to different structures may offer insights into other cellular disruptions.
Summary
To manage the vast amount of SEM image data, the team employed the Aivia software from Leica Micosystems, which uses deep learning to segment and analyze structures within the 3D image stack. Ground truth annotations were created to train the AI model, which was then applied to the full dataset for automatic segmentation. Manual corrections were made using a 3D editing tool to refine the segmentation, especially for delicate structures like flagella.
The segmented data enabled quantitative analysis of organelles such as hydrogenosomes, endosomes, lysosomes, ER and Golgi. While hydrogenosomes were smaller in average volume, they were numerous and often located near structural landmarks like the costa and axostyle. Spatial analysis revealed weak correlations between hydrogenosome size and proximity to these features, offering new insights into the organism’s cellular organization and physiology.
Acknowledgements
The authors like to thank Isabelle Guerin-Bonne and Low Kay En of the Electron Microscopy Unit at Yong Loo Lin School of Medicine, National University of Singapore for providing samples and SEM images, and Benoit Malleret for insight into the nature of Trichomonas species.


-b-poly(isoprene). Right: Poly(styrene)-b-poly(methyl methacrylate).")