
Introduction
Particles as critical contamination: industry sectors having cleanliness requirements
Contamination sensitive products and product components produced for the transportation (automotive/trucks, aviation/aerospace, railway), microelectronics (integrated circuits, printed circuit boards, semiconductors), and health care (pharmaceuticals and medical devices) industries have very strict demands for cleanliness in order to increase their performance, reliability, and lifetime [1].
Types of contamination and how they are generated
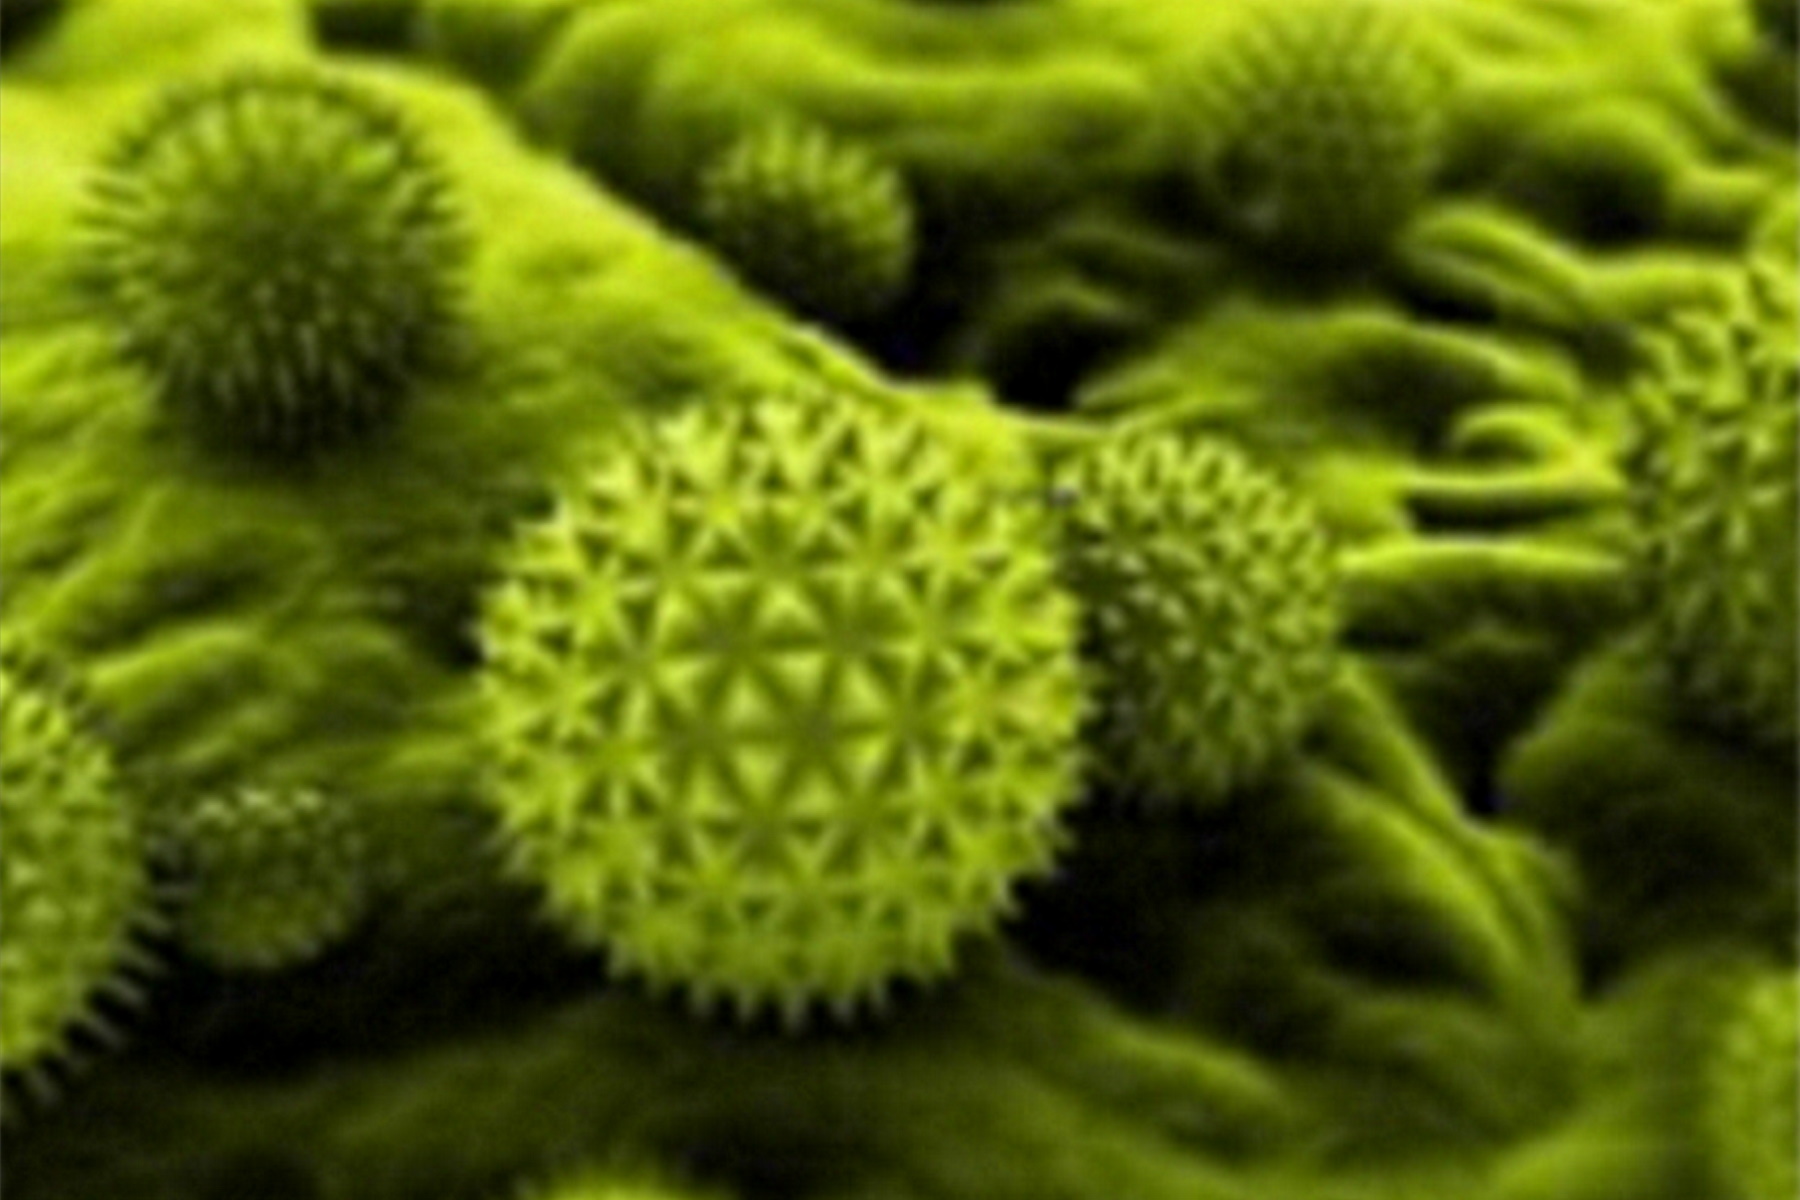
There are several basic types of contamination [1] (refer to Figure 1):
- Particulate contamination: either inanimate and inorganic, such as the residue from a manufacturing process, e.g. particles from abrasion or grinding or dust from the local surroundings, or biological and organic, such as bacteria, fungi, spores, flakes of shed skin, or cell fragments; or
- Molecular contamination: either organic and inorganic films, such as the residue from additives during manufacturing, e.g. low temperature lubricants or preservatives, or finger prints.
This report will focus on particulate contamination with the aim of determining the degree of cleanliness, as well as, validating the particle cleaning efficacy.
 residue particles from production method; b) dust; c) spores; d) bacteria; e) inorganic or organic films; and f) fingerprints.")
Factors which influence product and product component cleanliness
Personnel, logistics, consumables, and processes. For every organization that manufactures products and their components which are subject to cleanliness requirements, there are certain factors which influence product cleanliness. These factors are the cleanroom technology chosen for production, the concept and planning of logistics, the actions and behavior of the staff and personnel, and the type of equipment, materials, and processes used for production (refer to Figure 2).
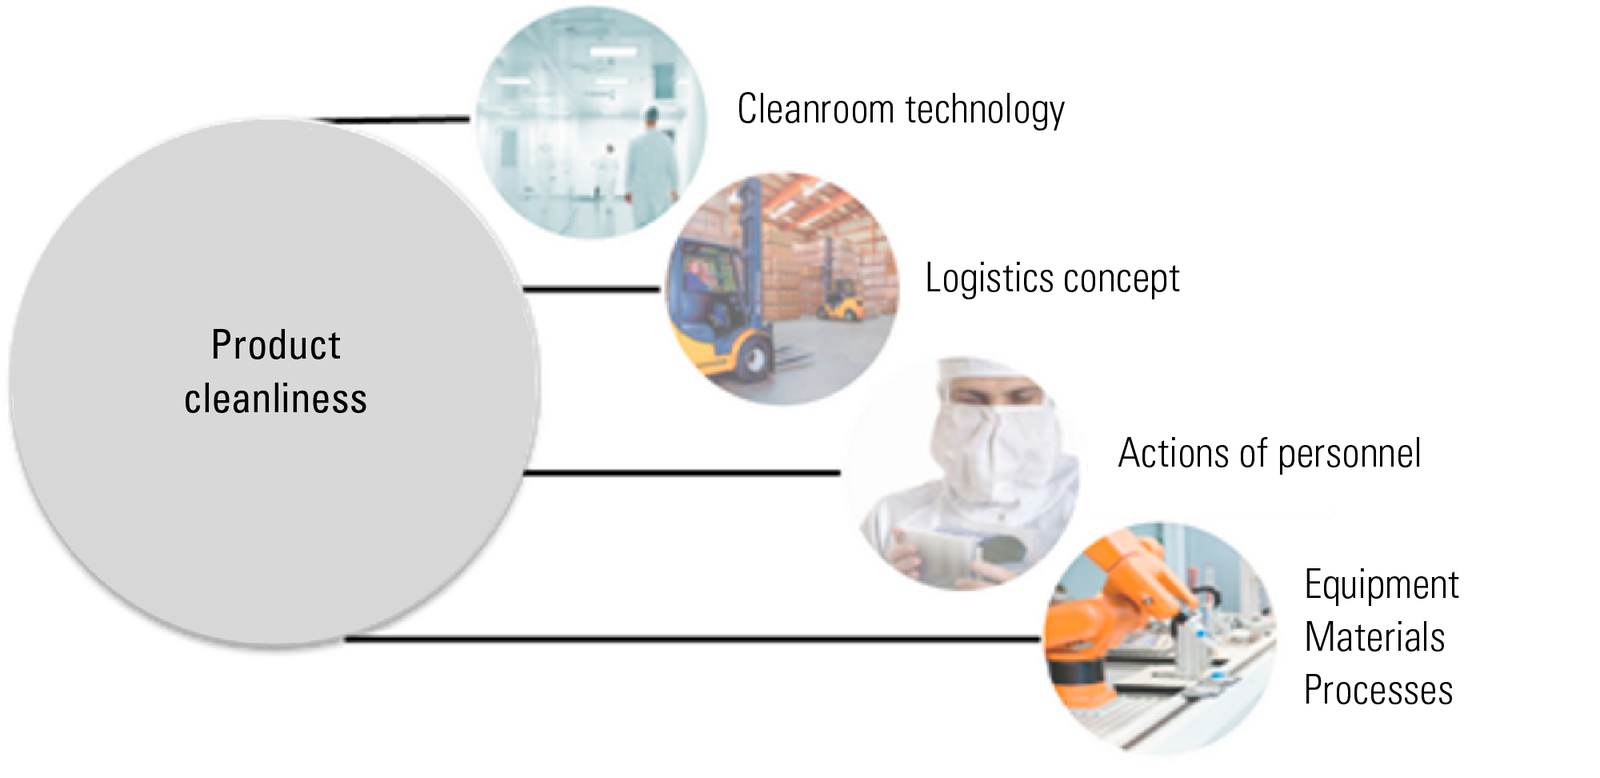
Fig. 2: Diagram showing the factors of a manufacturing organization which can influence product cleanliness [1, 2].
Efficacy of cleaning systems. An important question is how well do cleaning systems work? Unfortunately, there is no general answer to this question. The resulting degree of cleanliness depends upon 3 main factors (refer to the diagram in Figure 3):
- the cleaning method or process;
- the type and amount of contamination; and
- the properties of the object which must be cleaned; its material, shape, and surface conditions (roughness, etc.).
Validation of the cleaning efficacy is necessary when the resulting degree of cleanliness is dependent on each specific case, there is a legal requirement, it is usual practice in the field or industry in question, and/or the customer or user specifically requests it.

Methods and procedures
Determining product cleanliness
Evaluation of cleanliness and cleaning processes. The assessment of cleanliness for particulate contamination, both before and after the product component undergoes a cleaning process, can be done by 2 approaches: a direct method or an indirect method [1].
A direct method involves the direct examination of surfaces without extraction or transfer of particles, normally with optical or electron microscopy. The advantages of a direct analysis are no sampling losses and no involved extraction method is required. However, the disadvantages are that only particles with sufficient contrast to distinguish them from the substrate can be detected easily and it is not practical for components with complex geometries.
An indirect method involves extraction or transfer of particles from the surface under investigation, normally done by detachment in a liquid or gas medium, stripping, or tape lift, followed by evaluation with an analytical system. The advantages of an indirect process are that it is practical for components with complex geometries and the entire component is examined, but the disadvantages are particle losses during the extraction step, higher expense due to the extraction method, and that very clean working conditions are required to avoid cross-contamination.
Cleanliness analysis for the transportation industry: VDA part 19 and ISO 16232. For the automotive industry, it has become the established practice to follow the guidelines defined by VDA 19 [3] and ISO 16232 [4] for the quantitative determination of particulate contamination on product components and parts. The particle contamination is removed from the surface of the components with the help of different extraction methods, such as sonication, pressure rinsing, functional test benches, agitation, and then transferred onto a membrane filter, e.g. via filtration of the extraction liquid. In the analysis stage, the particles can be evaluated with various techniques depending on their sizes and material properties, such as optical microscopy, scanning electron microscopy (SEM), or x-ray energy dispersive spectroscopy (EDS). The steps of the cleanliness analysis are shown in Figure 4. A comparison of the particle analysis techniques is seen in Figure 5.
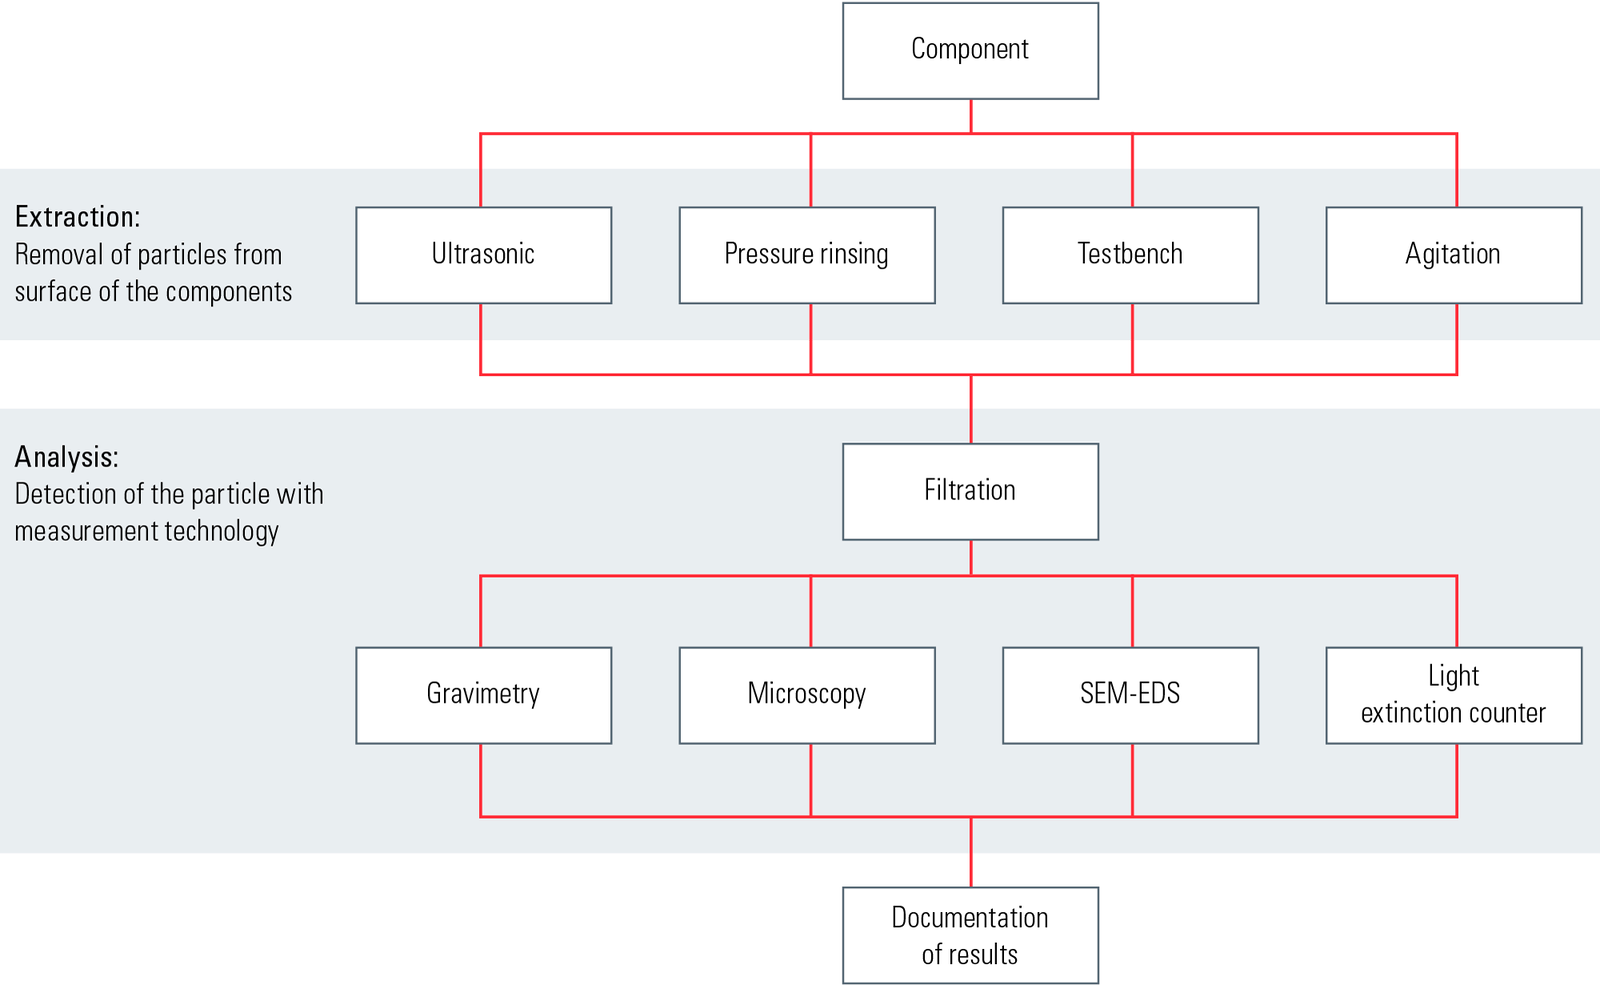
Image producing methods for particle analysis: information content and prerequisite conditions
For particle analysis with image producing methods, optical (light) microscopy is certainly the most widespread technique. When dealing with requirements for cleanliness inspection, optical microscopy is one of the least expensive investments in comparison to other methods and one of the fastest for analysis. SEM/EDS is more often used for in-depth research, such as cause studies, where more detailed information, e.g. elemental composition of the particles, is needed.
 microscopy, scanning electron microscopy (SEM), and micro-computed tomography (micro-CT).")
The optical resolution of the microscope is the limiting factor in terms of particle detection. When a particle cannot be resolved by the optical system itself, because its dimensions are below the resolution threshold, then none of the particle’s detailed features will be discerned. The resolution (R) of an objective lens is dependent upon the wavelength (λ) of the light used for illumination of the sample and the numerical aperture (NA = n • sin α) of the lens:

where n is the index of refraction of the medium in which the objective lens is immersed and α is the half angle of the maximum cone of light which enters or exits the objective lens (refer to Figure 6) [5].

The particle brightness contrast with respect to the membrane filter background must be sufficient in order to accurately detect the particles. Once a threshold value is set using a well-defined gray value, the analysis of particles recorded within the image can be carried out via binarization (refer to Figure 7). One extreme example is the case of white particles on a white background making it very difficult to find a gray value which allows the particles to be distinguished and, therefore, rendering automated analysis nearly impossible.

Application examples
The particle analysis was done with a Leica Cleanliness Expert system using a Leica compound microscope and the Leica Cleanliness Expert software. The minimum particle size that can be reliably detected and analyzed is 5 μm.
Monitoring the deposition of particles from the local environment
For many contamination sensitive products, there are requirements for the production environment, where often such products are produced in clean rooms fulfilling a certain air cleanliness [6]. From the monitoring of airborne particles alone, usually carried out with a particle counter, no clear conclusions about the level of particle sedimentation from the local environment can be made. There are multiple sources for particles, usually in relation to personnel/staff, the logistics process, packaging, consumable material, and the production process. In order to quantify the sedimenting contamination in a clean production environment, 10 sedimentation plates were placed at critical process positions. Sedimentation plates collect sedimenting particles on an adhesive tape. After the exposure time of seven days, the sedimentation plates were evaluated with an optical microscope.
The results of the particle analysis for all 10 sedimentation plates are shown in Figure 8. The chart in Figure 8 shows clearly there are measurement positions having higher particle counts. An additional classification by means of different features, such as morphological aspects or shininess, could allow fibers and reflective particles to be distinctly identified.

Characterization of particles potentially causing damage
For many product components in the automobile industry, there are requirements regarding particulate contamination. Depending on the component, certain particles could be critical and cause damage. In many cases, even extra testing is done in order to examine systematically the damage effect from particles of different size. For these tests, particles with a reasonably well-defined morphology, i.e. defined as well as possible, are needed. To characterize such particles, the length and width were detected by automated software analysis and additional manual analysis allowed particle height measurement. For the height determination, an optical microscope with an objective lens having a low depth of field was exploited. By focusing on a point in the filter background and then the highest point of the particle, it was possible to detect the particle height from the difference in z-values.
The results from characterization of standardized particles using the analysis described above are shown in Figure 9.
, width (red), and length (blue) in µm.")
Cleaning method efficacy: comparison of non-cleaned and cleaned components
A check of the cleaning method efficacy was done by comparison of cleanliness analysis results for a non-cleaned and cleaned component, both subjected to the indirect validation process (refer to Figure 10). The results in Figure 10 clearly show that the cleaning method reduced significantly the presence of particles on the surface of the product component in the size range of 50 µm to 600 µm.
 and cleaned (red) component which has been subjected to an indirect process for cleanliness validation.")
Summary and conclusions
Cleanliness has been proven to help improve product quality via investigations done for diverse products or product components from multiple industries. At present, cleanliness analysis plays an important role in the automotive industry which has established international standards for analysis of component cleanliness. Validation techniques for cleanliness have been discussed which ascertain the degree of cleanliness via the use of a quantitative approach involving particle analysis. The validation is done by either a direct process, direct examination of the component surfaces without extraction of particles, or an indirect process, extraction of particles from the component surfaces. In this report only an indirect validation process, applied to the removal of particulate contamination, was discussed in detail. The particle evaluation methods often utilize optical or electron microscopy. Useful results have been reported here demonstrating an indirect cleanliness validation process using optical (light) microscopy for particle analysis. The efficacy of a product cleaning process, i.e. its ability to achieve a specific level of product component cleanliness, has also been validated with an indirect process.
References
- Kreck G, and Holzapfel Y: Reinheitsvalidierung von kontaminationskritischen Produkten. reinraum online (Dec. 2012); reinraum printline 4–9 (Jan. 2013).
- Gail L, Gommel U, and Hortig H-P: Reinraumtechnik, 3rd Edition. Springer, Berlin/Heidelberg (2012).
- VDA part 19 (2004): Inspection of Technical Cleanliness Particulate Contamination of Functionally Relevant Automotive Components, 1st edition.
- ISO 16232 (2007): Road vehicles, Cleanliness of components, Parts 1–10.
- Abramowitz M, and Davidson MW: Microscope Objectives: Numerical Aperture and Resolution. Molecular Expressions, Optical Microscopy Division, National High Magnetic Field Laboratory, Florida; Optical resolution, Wikipedia.
- Rochowicz M: Große Schritte für die Technische Sauberkeit. Journal für Oberflächentechnik (JOT) 53 (16): 10–11 (2013).


