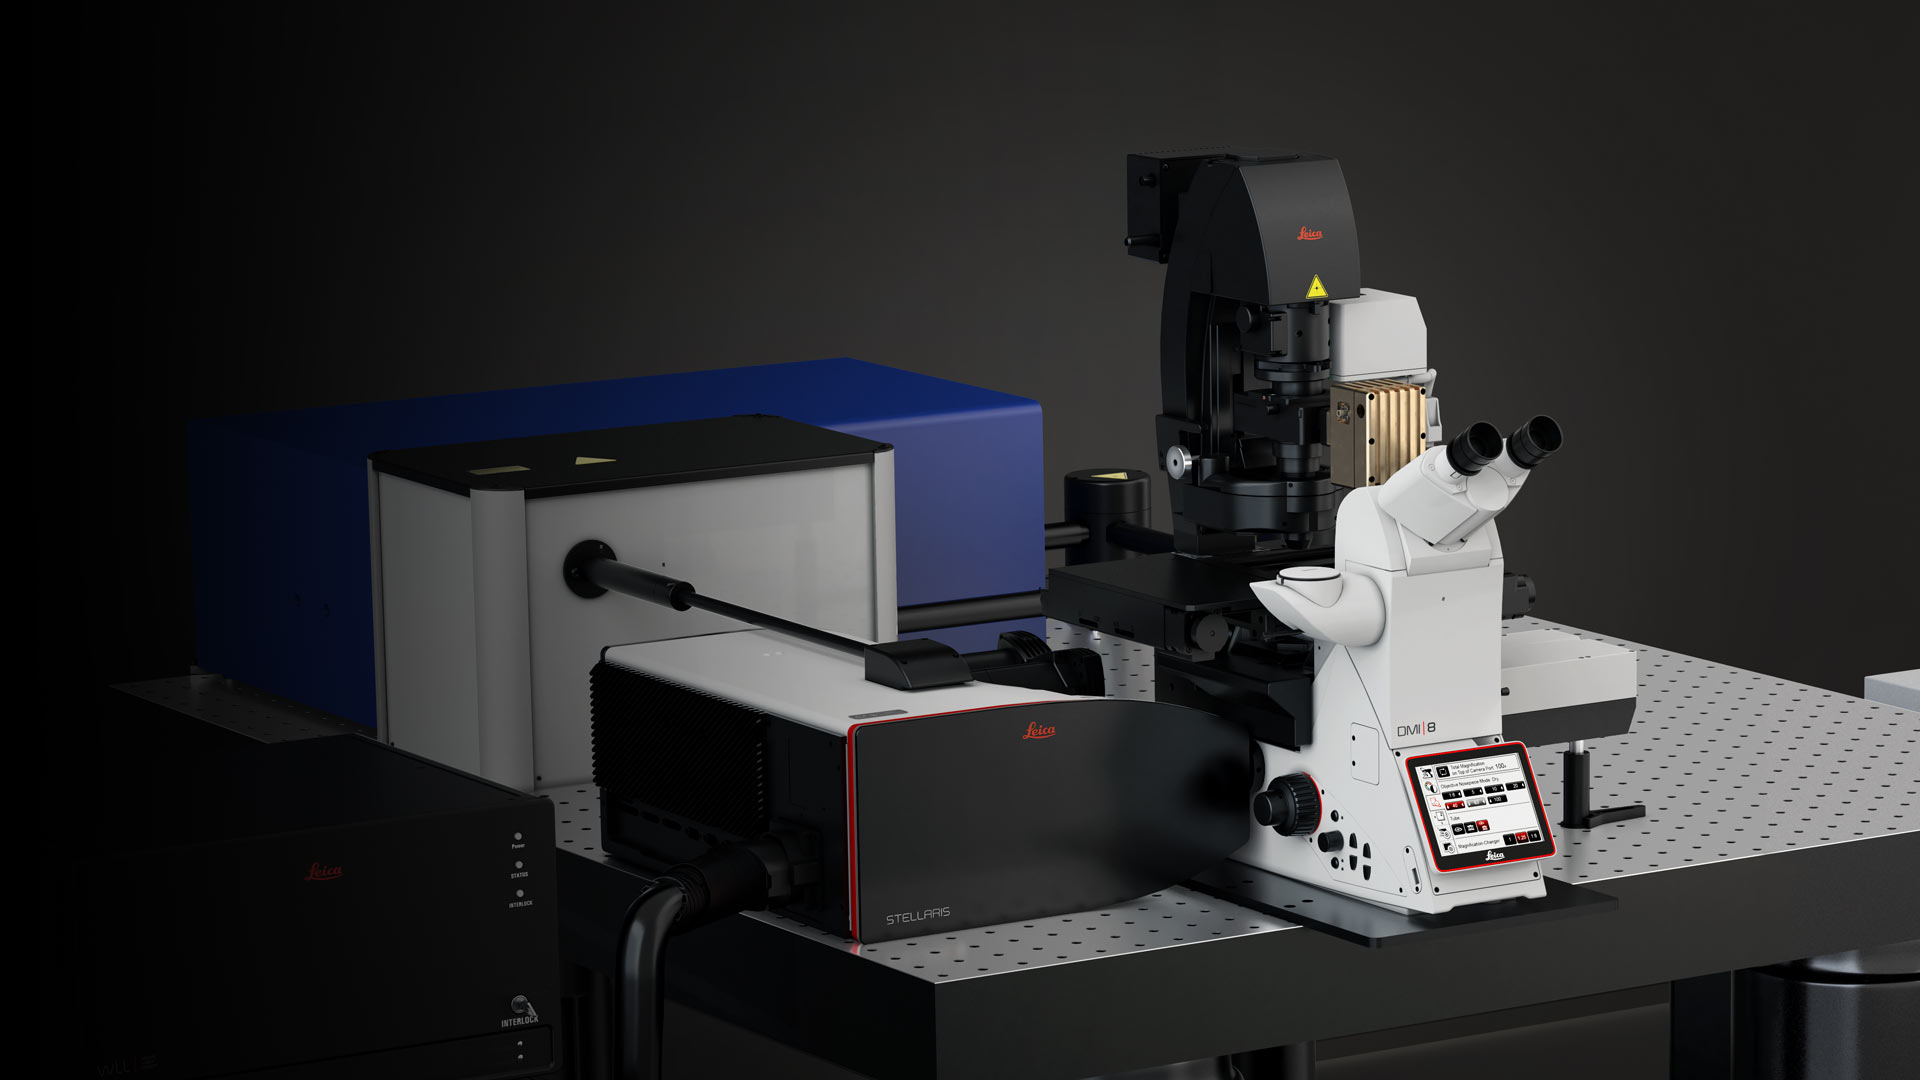
STELLARIS CRS Coherent Raman Scattering Microscope
Label-free chemical imaging using the STELLARIS Coherent Raman Scattering (CRS) microscope enables you to obtain crucial biochemical and metabolic information that cannot be visualized with traditional fluorescent microscopy methods.
With STELLARIS CRS, you can image a wide range of specimens at the required high speed and resolution to follow essential processes of life. Take advantage of different modalities to maximize the information you get from your sample: Stimulated Raman Scattering (SRS), Coherent Anti-Stokes Raman Scattering (CARS), Second Harmonic Generation (SHG), two-photon fluorescence, and visible confocal fluorescence.
Explore the potential of morpho-chemical and functional information in your imaging experiment
To tackle challenging problems in the life sciences and fundamental medical research, it is frequently necessary to maximize the information gained from your samples. This often includes the need for imaging of non-traditional targets, such as changes in lipid metabolism.
STELLARIS CRS provides you with a fully integrated system that allows you to acquire and correlate a wide range of biochemical and biophysical contrasts – in addition to confocal fluorescence intensity and lifetime information – to get the most out of your experiment.

Gain information on the biochemical composition of your sample
The combination of morphological and biochemical information can be crucial for the understanding of healthy biological functions and any changes caused by disease.
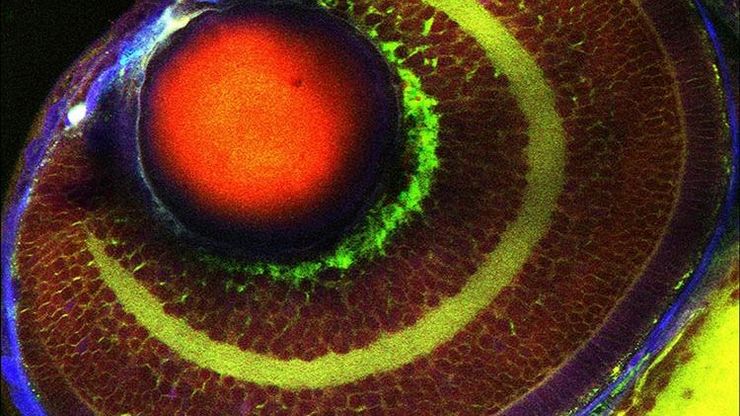
STELLARIS CRS provides label-free imaging with chemical contrast at an unprecedented spatial resolution. With CRS, biological functions can be probed on many spatial scales, ranging from subcellular organelles to groups of cells in a tissue or even pathological structures that perturb tissue function.

Reveal new dimensions relevant to development and disease
Direct visualization of cellular phenotypes and metabolic states is key to understand biological processes in health and disease. Sample processing may alter these properties, so a label-free approach can be a preferred alternative.
CRS imaging provides the spectroscopic capabilities that enable a detailed study of your sample under conditions as close to real life as possible.

Combine confocal fluorescence imaging with chemical imaging
To get an unparalleled view of the multiple biological dimensions of your sample, STELLARIS CRS provides several imaging methods tightly integrated into the confocal system. They enable multi-modal optical imaging with biochemical, biophysical, and molecular contrast.
- Stimulated Raman Scattering (SRS)
- Coherent Anti-Stokes Raman Scattering (CARS)
- Single-photon or multi-photon fluorescence
- Second Harmonic Generation (SHG)
- Imaging with infrared (IR), visible (VIS), and ultraviolet (UV) lasers in simultaneous or sequential mode

Explore new possibilities with vibrational and lifetime imaging
Many biological specimens exhibit fluorescence emission, arising either from endogenous fluorophores or from intentional fluorescent labeling. Whereas SRS signals are not affected by fluorescence, CARS signals may experience some degree of fluorescent crosstalk.
The TauSense tools in the STELLARIS platform can help solve this issue. By using fluorescence lifetime-based information, you can separate instantaneous CARS signals and fluorescence signals.

Boost your productivity with inherently quantifiable data
STELLARIS CRS offers all the versatility and ease-of-use available with the STELLARIS platform. This integration allows you to handle a wide range of challenging samples and helps you maximize the benefits of CRS imaging, including obtaining inherently quantifiable data from ratiometric and spectroscopic imaging approaches.

Easy setup of experiments with a fully integrated system
Every aspect of your experiment is fully controlled through the ImageCompass user interface, offering a convenient and intuitive approach to CRS microscopy for both experts and beginners.
Additionally, the integration of the CRS laser control into ImageCompass allows users to go from single-chemical-bond imaging to spectroscopic imaging or multi-modal imaging in just a few clicks.
Navigate large and complex samples with ease
The LAS X Navigator is a powerful tool that allows you to quickly switch from searching image by image to seeing a full overview of your sample. The full integration of CRS multi-position experiments with Navigator allows you to perform full tile scans of large samples, providing all the information needed to choose regions of interest for subsequent, more detailed investigations.

Quantifiable information from hyperspectral or ratiometric imaging
Inspired by approaches developed by the Raman spectroscopy community, CRS enables ratiometric and spectroscopic imaging that provide reproducible and quantifiable information about the sample's chemical composition. These basic quantification tools are integrated in the LAS X software.

Gain the power to image targets inaccessible with traditional methods
While traditional fluorescence microscopy methods are highly successful research tools, the type and number of targets that can be visualized are limited. STELLARIS CRS helps you overcome these limitations:
- Utilize chemically specific endogenous contrast to visualize structures and processes that are largely inaccessible with traditional methods
- Obtain three-dimensional image information that enables observation of fine details even inside complex 3D specimens
- Benefit from minimally perturbative excitation for dynamic studies with the specimen maintained as close to physiological conditions as possible, from video-rate imaging to long-term observations of sensitive specimens.

Follow complex biological processes in living samples
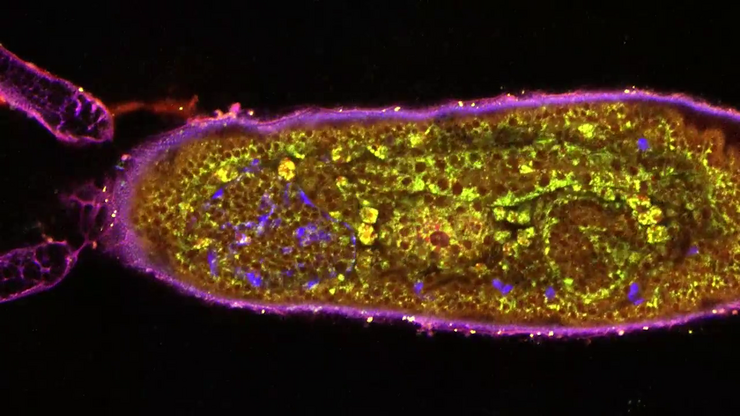
Follow the dynamics of multiple chemical species at few-second timescales, by leveraging the rapid multiplex chemical imaging capabilities of STELLARIS CRS using the fast-tuning picoEmerald FT light source.
Video sample courtesy of Dr. Matthew Benton, EMBL Heidelberg.
Acquire statistically significant biochemical image data in less time
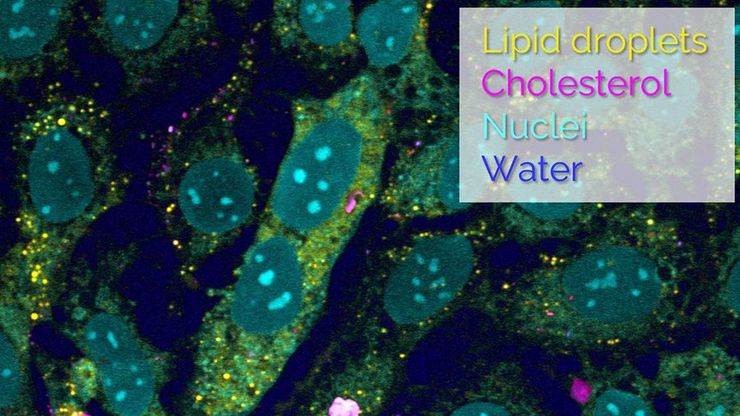
Developmental processes or diseases result in altered metabolic states of cells and tissues. These metabolic states are reflected in the endogenous biochemical composition and spatial organization of cellular organelles.
With STELLARIS CRS, users can probe this biochemistry with spectroscopic imaging at 12 cm-1 spectral resolution.
Strongly improved signal quality and faster laser tuning compared to previous-generation instruments results in order-of-magnitude faster multiplex chemical imaging , allowing users to acquire statistically significant biochemical image data in less time.
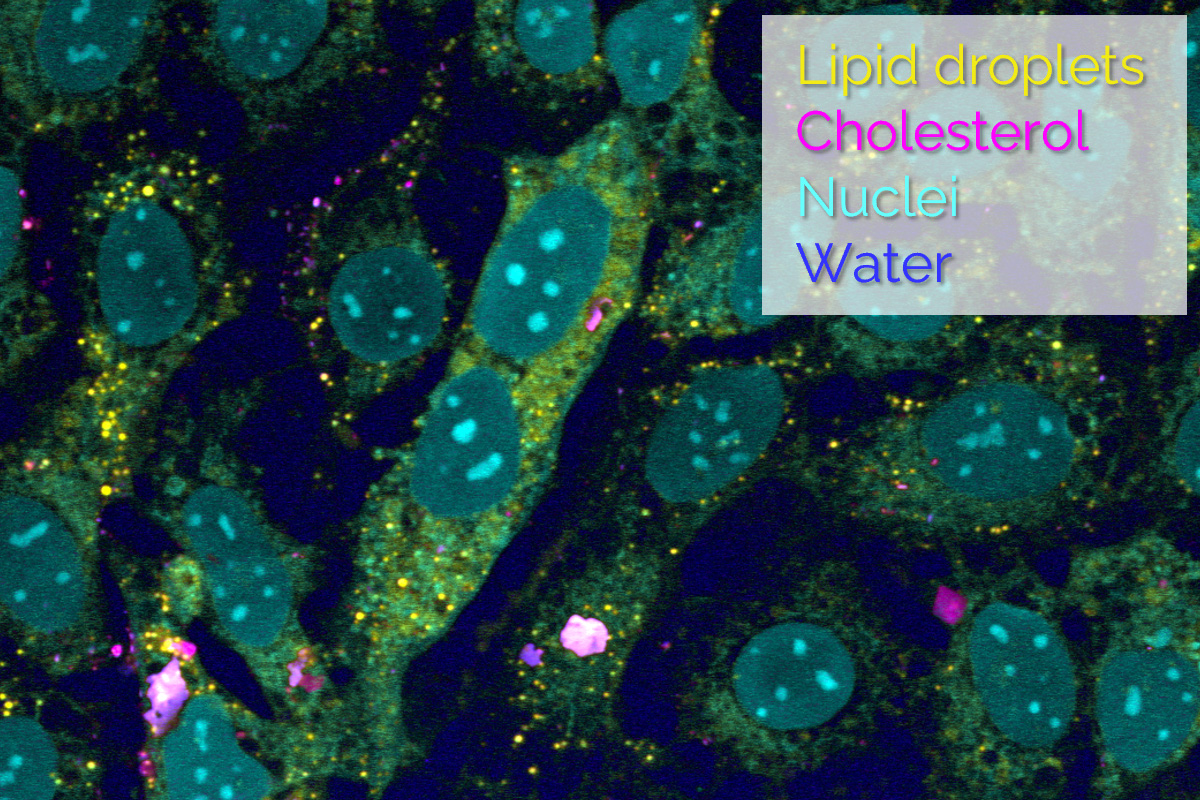
Image structures and events without a need for fluorescent dyes
The STELLARIS CRS microscope allows users to image and differentiate structures and events using their chemical properties. This way, it can provide access to a vast amount of biochemical, metabolic, and pharmacokinetic information that is inaccessible via traditional methods.
Image contrast in CRS is provided by the characteristic, intrinsic vibrational states of the different molecules in the specimen. Thus, no staining of the specimen is needed eliminating the drawbacks of dye-based imaging methods, such as photobleaching and staining artifacts.

Built-in three-dimensional imaging for 3D samples
STELLARIS CRS is perfectly suited to image 3D samples, such as tissues, organoids, or intact small model organisms, at subcellular resolution by directly using their chemical properties. 3D imaging without a need for post-processing is a built-in property of CRS, thanks to a combination of two features:
- CRS signals are generated through a nonlinear optical effect that takes place exclusively inside the focal volume of the excitation lasers, providing intrinsically three-dimensional image information.
- The near-infrared laser beams used for CRS excitation propagate through the sample with minimal perturbation, allowing for efficient imaging even inside intact 3D specimens.
Image live specimens as close to physiological conditions as possible
The highly efficient excitation of molecular bonds by CRS provides chemically specific image contrast at unprecedented speeds. It enables the imaging of live specimens at video rates.
STELLARIS CRS is equipped with a Tandem Scanner that allows both conventional and high-speed imaging of many specimen morphologies.
In addition to speed, gentle imaging is essential to preserve live samples during long-term observation. The stain-free approach combined with the use of near-infrared lasers keep phototoxicity and photodamage at minimal levels.
