
Introduction
Widefield microscopy is characterized by the illumination of the complete specimen and differs from confocal microscopy where only a small spot is illuminated. Its variants, especially widefield fluorescence microscopy, are among the most applied techniques in life sciences. For example, the detection of various fluorescence markers in a specimen—fixed or alive— can deliver insight into many biological processes such as the human immune system.
The human body exhibits both innate and adaptive immune responses upon microbial invasion. Whereas the adaptive response develops a highly specific reaction over time, the innate response immediately reacts on special structures that are found on pathogens. They are called pathogen-associated molecular patterns (PAMPs). Lipopolysaccharides (LPS), which are specific to the cell walls of gram-negative bacteria, are a typical example of such a pattern. LPS binds to a special receptor on the surface of human cells—the toll-like receptor 4 (TLR4). Once bound, it can trigger an intracellular process ending up with the production of pro-inflammatory proteins called cytokines (Figure 1).
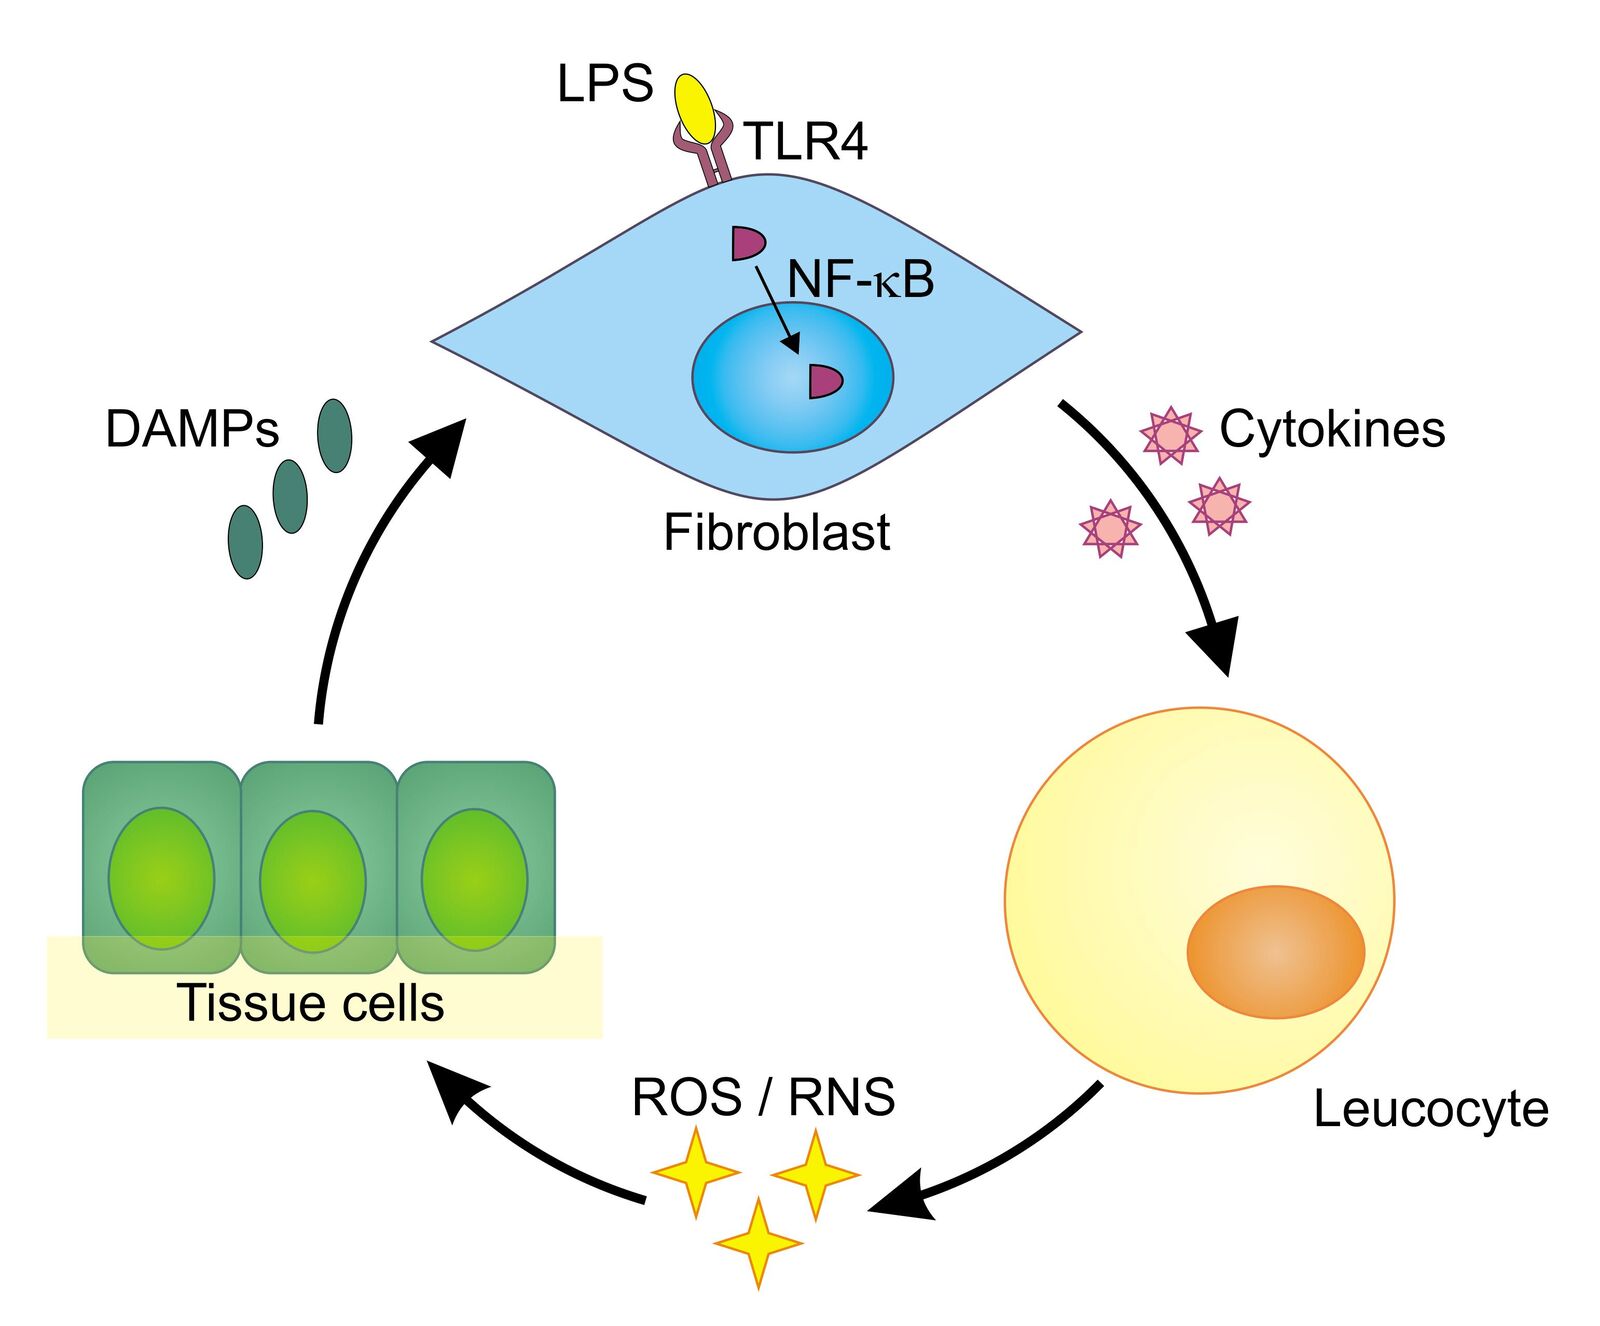
One step during this intracellular process is the translocation of the protein NF-κB from the cytoplasm into the cell nucleus. In its role as a transcription factor, NF-κB supports the transcription of the relevant cytokine genes. The produced cytokines afterward prompt white blood cells (leukocytes) to release reactive oxygen species (ROS) and reactive nitrogen species (RNS) that can kill bacteria and viruses. Unfortunately, ROS/RNS also cause collateral damage and can have negative effects on the cells themselves. Injured by ROS/ RNS, tissue cells release so-called damage-associated molecular patterns (DAMPs), which themselves can trigger TLRs, starting the whole process again and leading to chronic inflammation. This auto-amplifying toll-like receptor radical cycle (TLR radical cycle) can be associated with a number of diseases such as Parkinson’s disease, stroke, depression, (auto)immune disorders, or chronic obstructive pulmonary disease (COPD), to name but a few [1,2].
Besides the abovementioned intrinsic activation by DAMPs, there is also potential for substances originating from other processes to start the cycle. Examples are pro-inflammatory cytokines such as tumor necrosis factor alpha (TNFα), ROS such as H2O2 produced by further cellular processes, and radical inducing radiation.
Untangling the molecular processes of inflammation can be supported using an inverted research microscope. This article describes the relevance of widefield microscopy for our team. Initially we took the purchase of a confocal laser scanning microscope into consideration. Instead, a widefield fluorescence microscope in combination with deconvolution was chosen for practical reasons, such as short training time for students who join the group for only a limited period of time. Moreover, widefield fluorescence microscopy has very good live-cell imaging capabilities and applies relatively low light intensities, resulting in reduced cellular stress.
A widefield microscope equipped with various fluorescence filter cubes, dedicated objectives, fast filter wheels, climate control, and convenient imaging software can shed light on many facets of the TLR radical cycle. Starting from plain brightfield microscopy through to immunofluorescence experiments, and live-cell and FURA imaging, we can investigate important phenomena, such as the fate of affected tissues in animals, the triggering of TLR4 with LPS and subsequent translocation of NF-κB to the nucleus, and the Ca2+ reaction upon inflammation.
Materials and methods
Cell culture. For immunofluorescence imaging of NF-κB, HeLa cells stably transfected with human TLR4, MD-2 and CD14 were used. Cells were cultured in DMEM (Dulbecco’s Modified Eagle Medium) supplemented with 10% FCS (fetal calf serum) and antibiotics, according to the manufacturer’s instructions. For microscopy experiments, cells were seeded on glass coverslips and used for experiments upon reaching 60–80% confluence.
Imaging. All images were taken on a Leica DMi8 inverted microscope with Leica Application Suite X (LAS X) software, equipped with a Leica DMC2900 color camera for histological samples and a Hamamatsu Flash4 Cl sCMOS camera for fluorescence imaging. To perform live-cell experiments an incubation chamber was attached to the microscope body supplying 5% CO2 and 37°C. Blind deconvolution was executed with the AutoQuant algorithm embedded in the LAS X imaging software.
Immunofluorescence kinetics of NF-κB. For NF-κB translocation assay, cells seeded on coverslips were stimulated with 50 ng/mL LPS for 60 min. After stimulation cells were fixed using 4% formaldehyde in PBS (1×; phosphate-buffered saline; with calcium and magnesium; pH 7.0–7.2). Afterwards, fixed cells were stained for RelA (also known as p65)—a subunit of NF-κB—using a primary antibody and an Alexa Fluor568-conjugated secondary antibody. To identify nuclear areas cells were counterstained with DAPI. To visualize the cytoskeleton, Alexa Fluor 488 Phalloidin was used to stain actin filaments. Samples were embedded in ProLong Gold antifade reagent and imaged using a Leica HC PL APO CS2 63×/1.40 oil objective.
Transient transfection of HeLa cells with GFP-RelA. To observe NF-κB translocation in vivo, HeLa cells were transiently transfected with a GFP-RelA plasmid using electroporation. GFP-RelA was a gift from Warner Greene (Addgene plasmid #23255) [3]. After electroporation, the cell suspension was transferred into glass-bottom dishes containing cell culture medium. Twenty-four hours post transfection, cells were examined under the microscope using a Leica HC PL APO CS2 63×/1.40 oil objective and 2 × 2 camera binning. An image was taken every five min after stimulating cells with TNF-α (10 ng/mL).
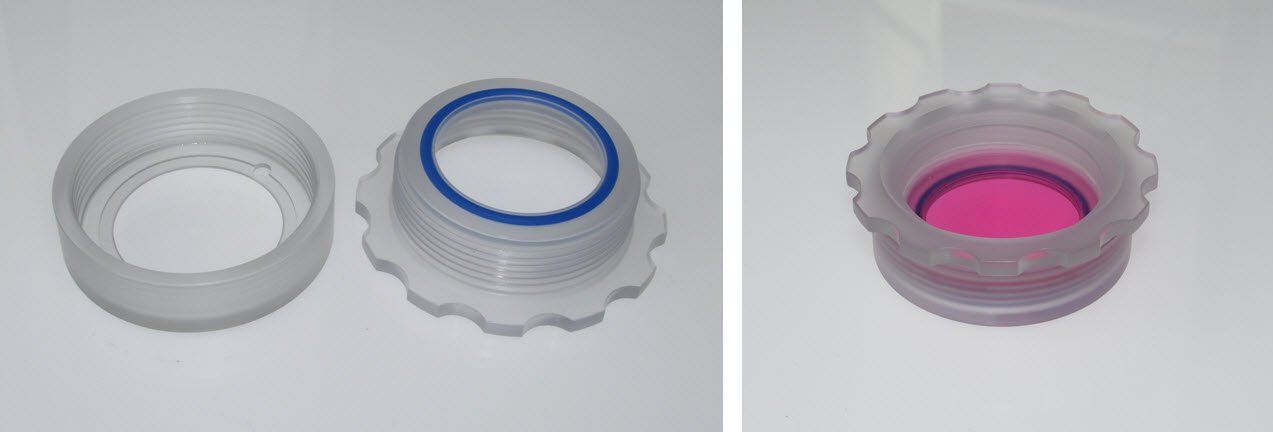
FURA imaging. For calcium measurement FURA-2AM (Sigma- Aldrich) was used. This FURA-2 derivate (acetoxymethyl) is membrane-permeable and capable of ratiometric experiments. HeLa cells were incubated with FURA-2AM (1 μM) for 30 min. FURA-2 has two excitation maxima according to its calcium status. Calcium-loaded FURA-2 is excited at 340 nm and free FURA-2 at 380 nm. The emission maximum is at 510 nm in both cases. For ratiometric experiments, fluorescence emission intensity was measured after 340 nm and 387 nm excitation, conducted by usage of fast filter wheels. For optimal illumination also at 340 nm, a Leica HC PL FLUOTAR (340) 20×/0.80 OIL objective with optimized transmission down to 340 nm was used. For the application of liquids a custom-made microdispenser was used. Image acquisition and ratio measurements were performed with the LAS X software. FURA imaging and live-cell imaging experiments were executed with the help of a custom-made plastic specimen holder, which was produced for comfortable specimen replacement. Cells grown on round cover glasses can be screwed between the two halves of the specimen holder and covered with liquid (Figure 2).
Histology. C57BL/6 mice at 4 weeks of age received 1.5% DSS (dextran sodium sulfate) dissolved in drinking water for 10 days. Afterward, the animals were sacrificed, and parts of the colon were collected for histology. The colon samples were processed and embedded in paraffin with the tissue embedding center Leica EG1150 according to routine laboratory methods. The paraffin blocks were cut in 4 μm thin sections using a Leica RM2255 microtome and a Leica HI1210 water bath. Afterwards, the sections were placed on microscope slides and stained with hematoxylin and eosin (HE) using a standard protocol.
The HE sections were examined under the microscope with a Leica HC PL Fluotar 20×/0.80 oil objective. According to the sample size, 10 single tile scans were imaged for the control and 21 single tile scans for the DSS-treated mice per slide and reassembled using the LAS X software. Figure 7 shows excerpts of 2 × 2 images in each case. All animal experiments were performed in the laboratory of Prof. Dr. Dr. Schuppan at the Institute of Translational Immunology of the University Medicine Mainz. The mice were housed, treated, and sacrificed complying with the regulations of Germany and the European Union, including the German Animal Welfare Act that implements the European Council Directive 2010/63/EU.
Results
NF-κB translocation to the nucleus upon LPS stimulation. Inflammation is a process triggered by signal cascades starting with the activation of pattern recognition receptors (PRRs) (Figure 1). One of these PRRs is the toll-like receptor 4 (TLR4). Upon LPS binding, the TLR4 complex induces intracellular signaling networks, finally activating the transcription factor NF-κB. The transcription factor then translocates from the cytoplasm to the nucleus and promotes the expression of pro-inflammatory cytokines [4].
The process of NF-κB translocation to the nucleus can be studied with the fluorescence microscope. For this purpose HeLa cells, stably transfected with a TLR4 construct were exposed to LPS for 60 min. After fixation, RelA—a subunit of NF-κB—was immuno-stained. As a control, non-stimulated cells were also labeled.
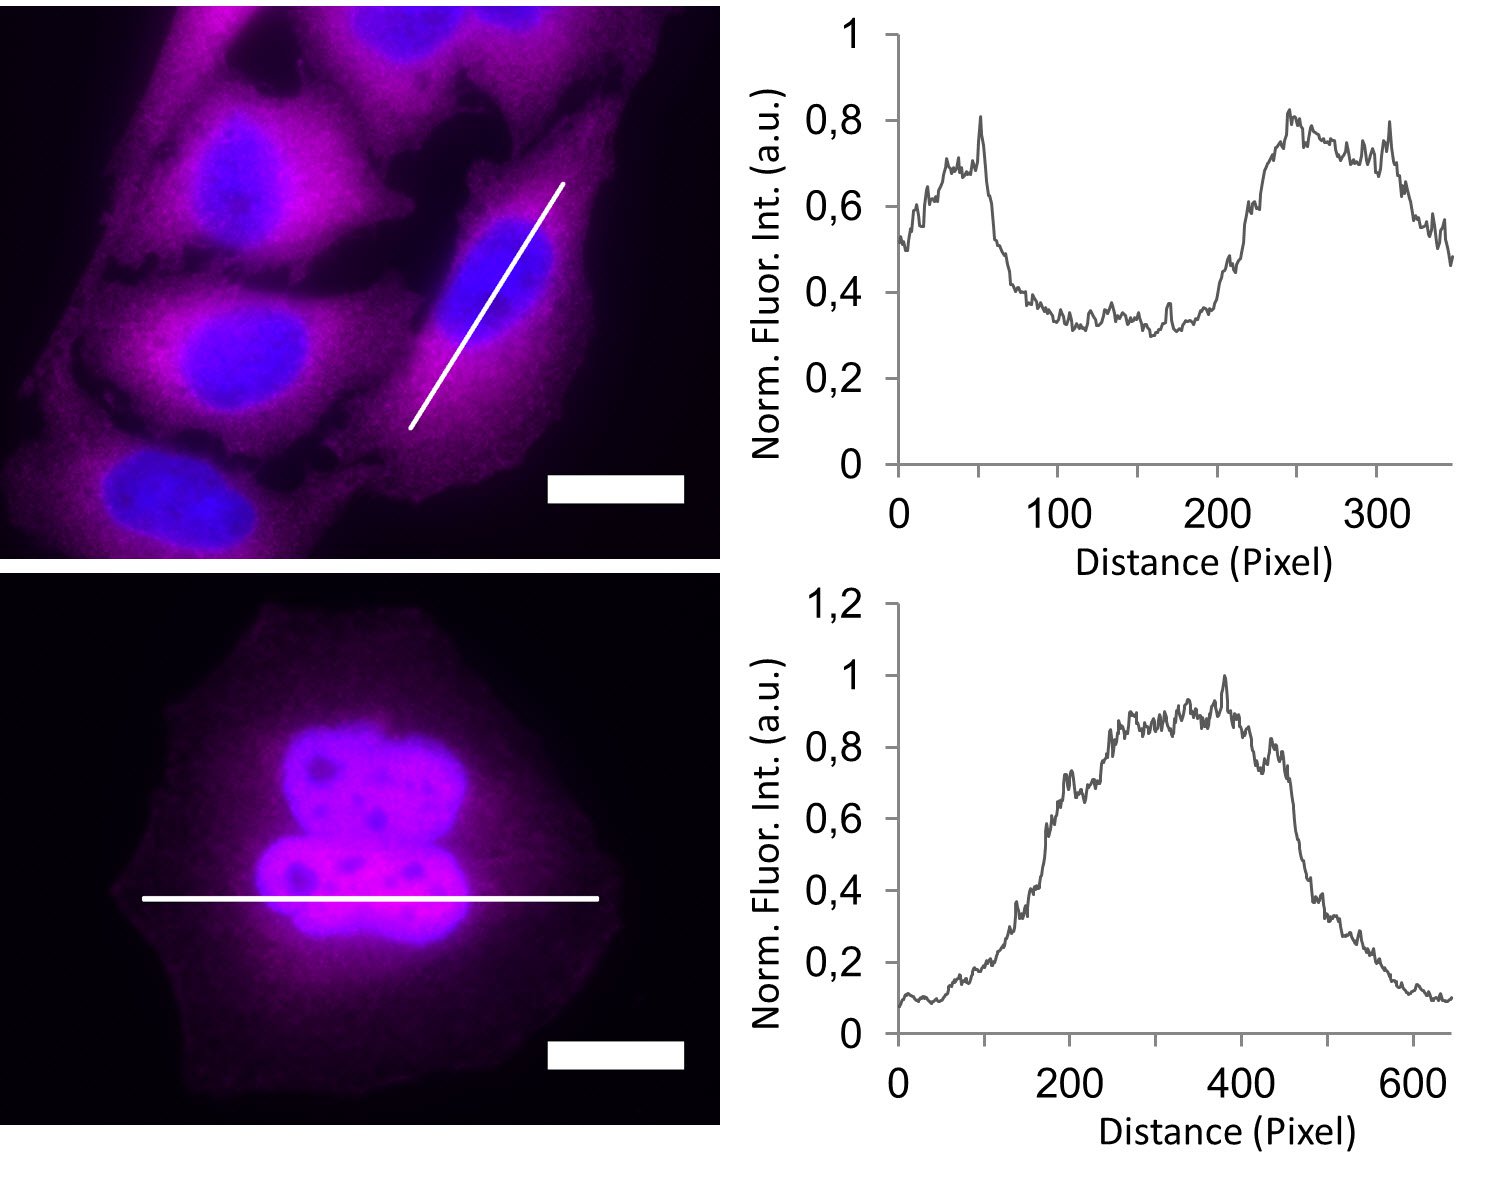
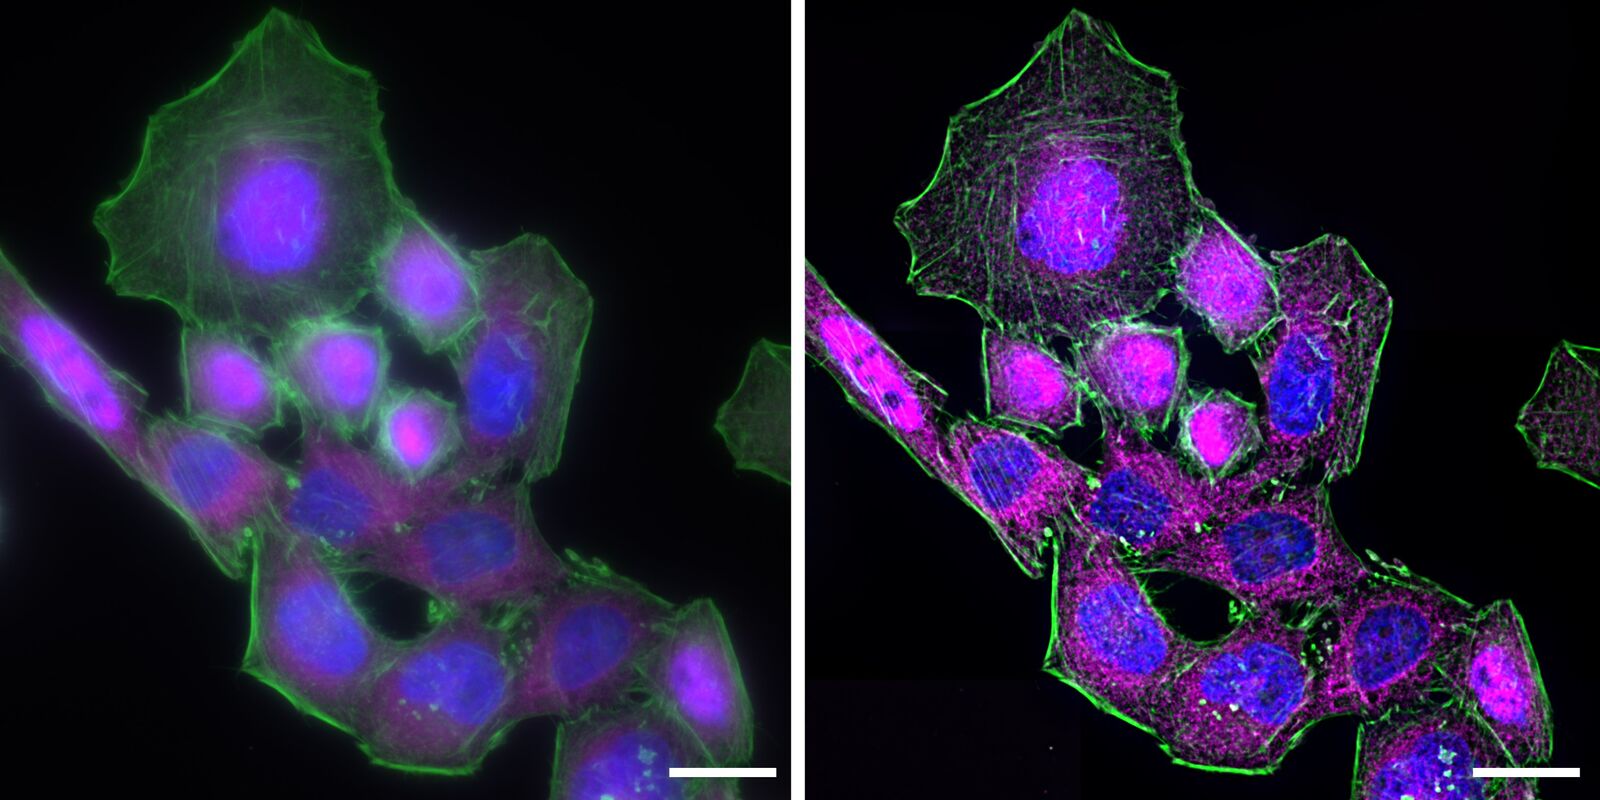
In the non-stimulated cells NF-κB (magenta) is located mainly in the cytoplasm (Figure 3). After stimulation with LPS for 60 min NF-κB translocates into the nucleus. Plotting the intensity profile of NF-κB through one cell confirms that the highest amount of NF-κB in non-stimulated cells can be imaged around the nucleus. Nonetheless, a low NF-κB signal can be detected inside the nucleus, which might be due to out-of-focus light coming from NF-κB molecules above and below the nucleus. Acquiring thin optical sections with a confocal microscope might reduce this occurrence.
Deconvolution is another option to circumvent misinterpretations derived from out-of-focus light. A widefield microscope does not only detect light in the focus plane but also, for example, scattered light coming from other regions. A deconvolution software algorithm can help to redirect fluorescent signals to their origin. Figure 4 shows such an approach. Immuno-stained HeLa cells were imaged with a fluorescence microscope followed by deconvolution, which is integrated in the imaging software. Compared to the original, the deconvolved image shows sharper details while still keeping quantitative data. Thus, the NF-κB molecules’ position can be determined more precisely.
One can imagine that these fluorescence-microscopy-based images can be used as a translocation assay by fixing cells at different time points after incubation and measuring the ratio of NF-κB between the nucleus and the cytoplasm. In such an assay, anti-inflammatory components could be tested, for example. The potential substance could be added to the cell culture, and its influence on NF-κB translocation could be directly observed. In contrast to other screening-based methods, this would give information at the single-cell level.
By transfecting cells with fluorescently tagged proteins, the kinetics of the protein of interest can also be detected by live-cell imaging. For this purpose, HeLa cells were transfected with the NF-κB subunit RelA-GFP. Besides LPS, there are other stimuli that provoke NF-κB translocation into the nucleus. One of them is TNFα. For this reason transfected HeLa cells were treated with TNFα prior to live-cell imaging (Figure 5).
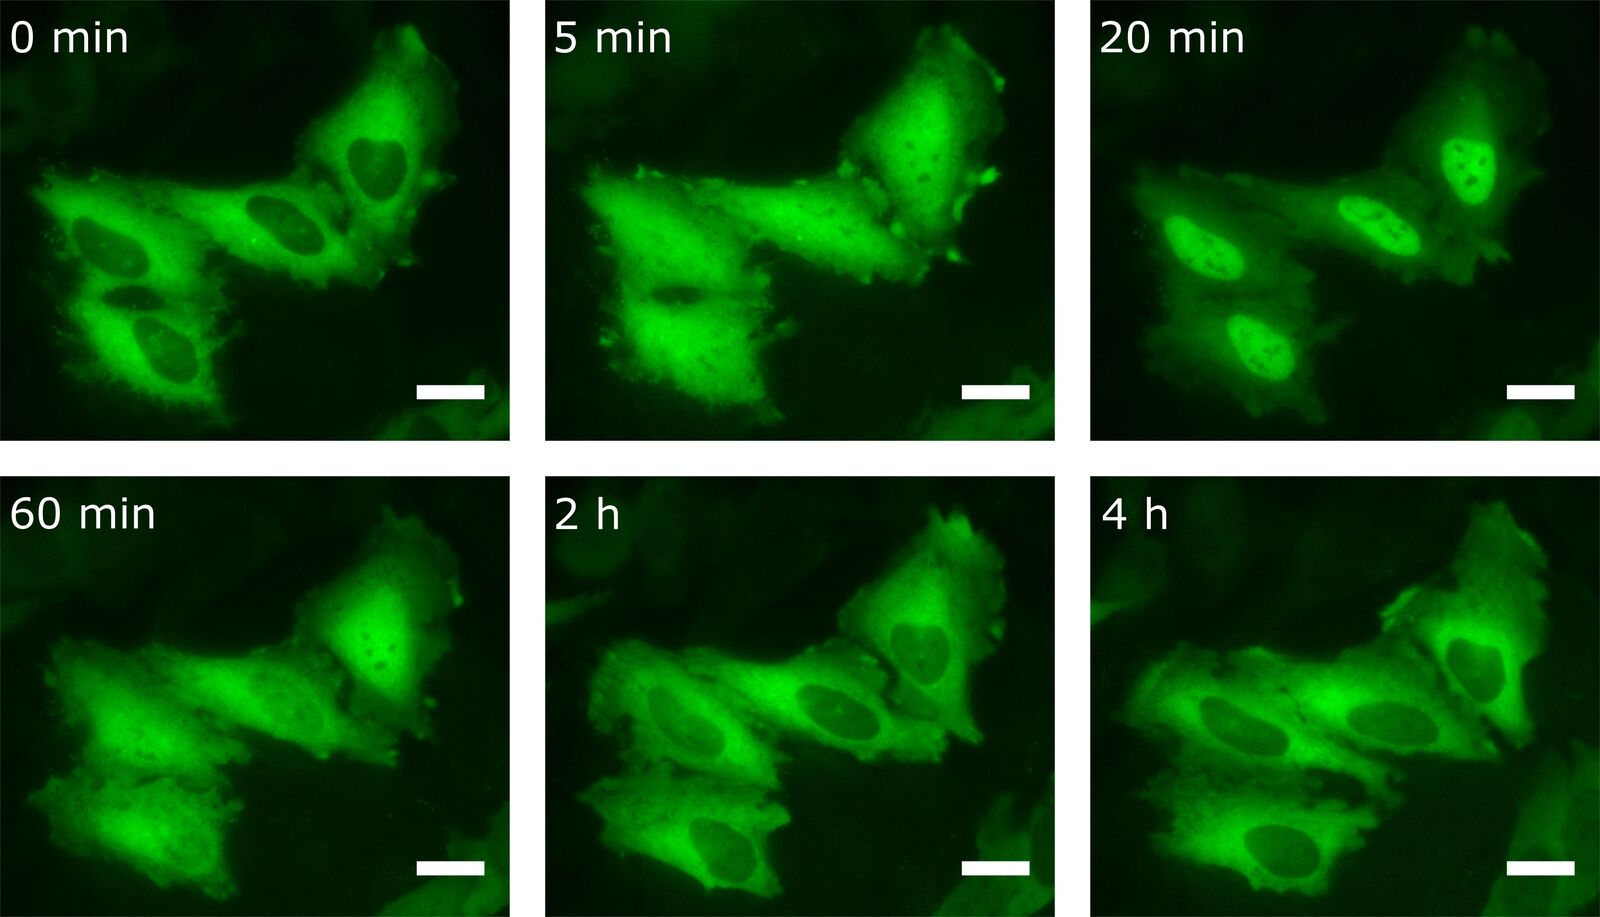
As one can see, the NF-κB concentration in the nucleus is heavily increased upon stimulation with TNFα. After 20 min most of the transcription factor has been translocated. Interestingly, after having reached this peak, NF-κB starts to relocate to the cytoplasm.
The fluorescence microscopy assays described above were established to use NF-κB as an indicator for inflammation. They can be used to test pro- and especially anti-inflammatory substances in a cell culture system. This might uncover potential treatments for chronic inflammation.
Electrical signaling during inflammation. Inflammatory reactions are linked to intra- and intercellular electrical signaling. Ion channels are highly involved in inflammation, and their expression and function can be influenced by LPS [5,6] or cyto- and chemokines [7]. Thus, in addition to the NF-κB translocation assays mentioned above, measuring ionic signals can give insight to the potency of pro- as well as anti-inflammatory stimuli. By quantifying intracellular concentration changes of calcium, sodium, and potassium ions, one can investigate both substances that stimulate inflammation and how to interrupt this process.
Intracellular calcium concentration can be imaged indirectly using fluorescent Ca2+ indicators. In general, ion-sensitive fluorescent dyes reversibly bind to specific ions and change their fluorescence characteristics upon binding. One of them is FURA-2, which belongs to the “dual excitation ion indicators.”
Depending on its binding status, it changes its excitation maximum. The Ca2+ unbound form gets excited at 380 nm and the Ca2+ bound form at 340 nm. By measuring the fluorescence intensity ratio at 510 nm, one can conclude the Ca2+ response. Using ratiometrics circumvents imprecisions linked to local differences in FURA-2 concentration or cell thickness [8].
To establish the method of ratiometric imaging in our lab, a protocol as well as a special hardware setup including a custom-made microdispenser were set up for HeLa cells. First measurements of a cellular electrical response were possible using the easily accessible example of ATP stimulation instead of inflammation. Here, ATP was used to provoke a typical physiological reaction fulfilled by the ubiquitously expressed P2Y receptor at the cell surface. This purinergic receptor triggers calcium efflux out of the endoplasmic reticulum (ER) into the cytosol, which then can be detected by FURA-2. Figure 6 shows the ratiometric experiment described above.
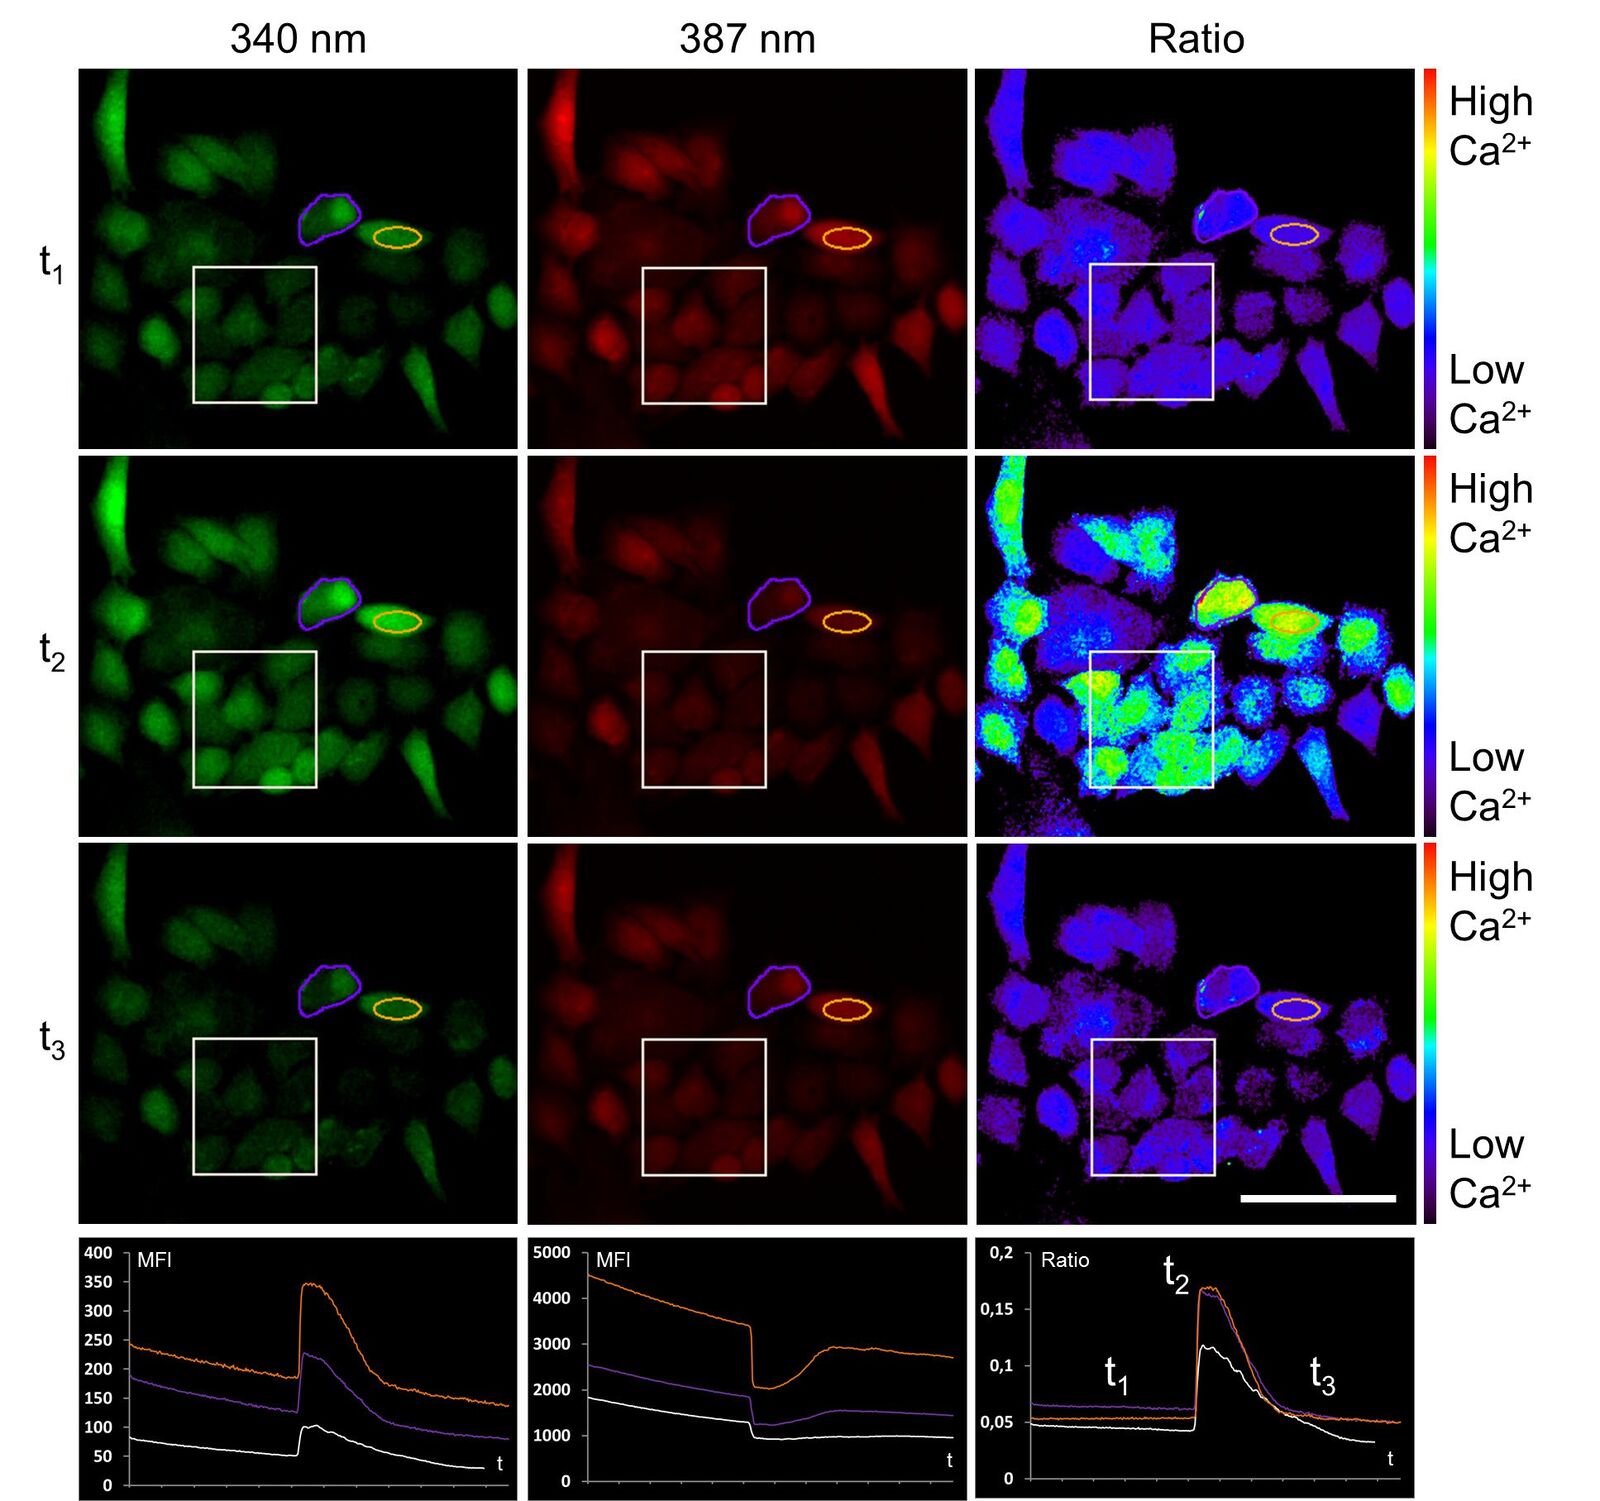
Upon ATP addition the fluorescence intensity of calcium-loaded FURA-2 (ex 340 nm) increases, whereas at the same time the fluorescence intensity of calcium-free FURA-2 (ex 387 nm) decreases. About 100 seconds post stimulation, calcium is transported back to the ER, and FURA-2 fluorescence activity is in the original state.
With the option of ratiometric imaging, one can investigate the role of the calcium potential during inflammation and respectively use it as an indicator for inflammation. For instance, the anti-inflammatory capability of local anesthetics can be examined with such a model.
Observing live cells under the fluorescence microscope requires special components to keep them alive and in near-natural conditions. With an incubation chamber, for example, an adequate environmental temperature can be controlled. To enable the investigation of several samples grown on cover slips consecutively, a custom-made sample holder was used (See Figure 2). With the help of this construction, one can image living cells. To this use for live-cell imaging or FURA imaging, the cover slips can be exchanged quite easily.
Investigation of ulcerative colitis in mice. The disease ulcerative colitis involves a chronic inflammation of the colon. Patients suffer from constant diarrhea intermingled with blood. The chronic loss of blood can lead to anemia and these individuals are exposed to a higher risk of colorectal cancer.
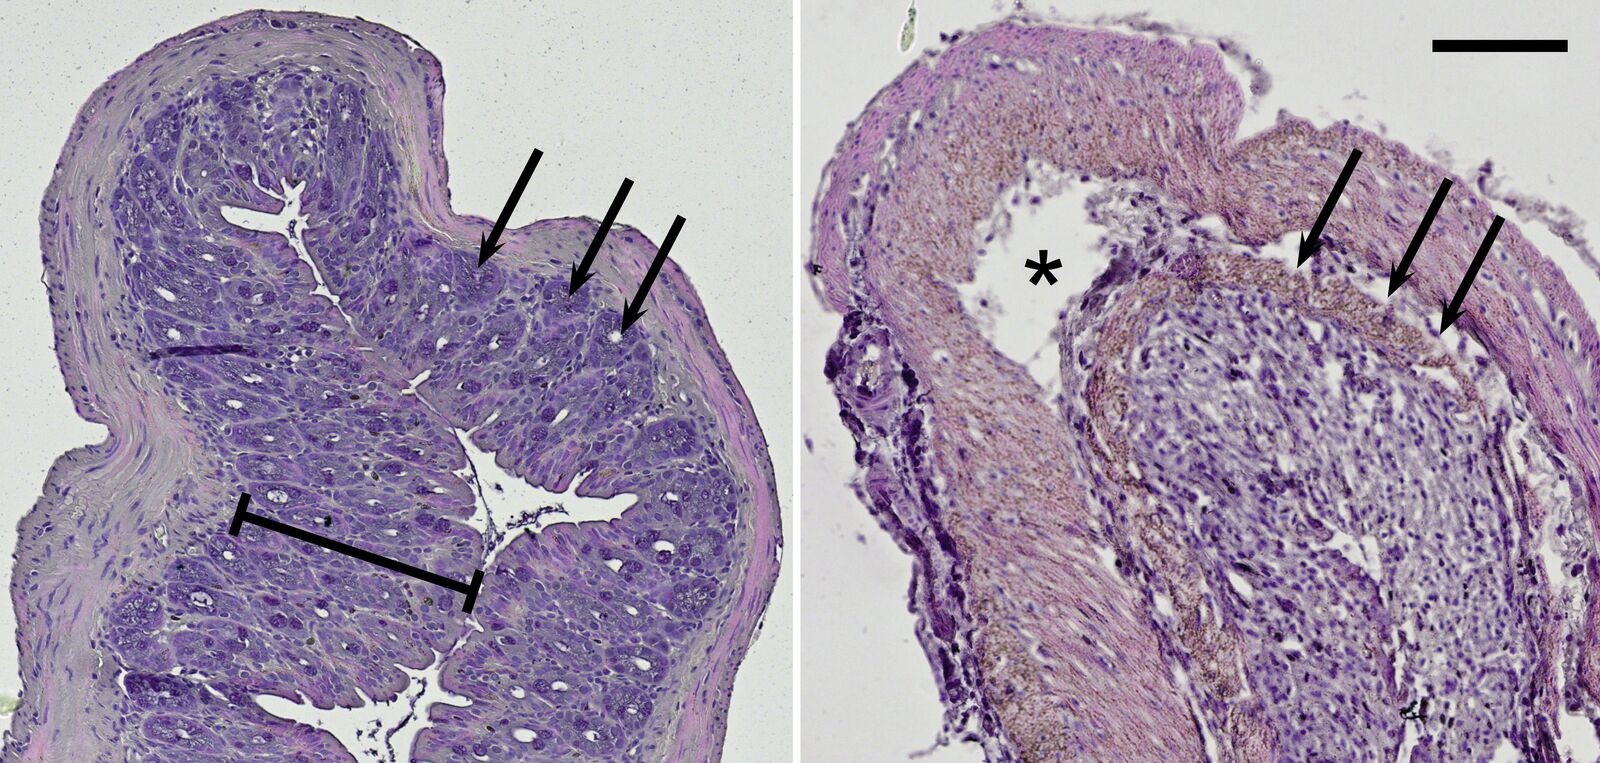
Because ulcerative colitis is a chronic inflammatory disease, it can be assumed that it is associated with the TLR radical cycle [9,10]. To have a closer look, a mouse model was used for examination in the lab. Interestingly, the intestinal disease can be provoked by DSS mixed into the animals’ drinking water [11]. Mice treated with this diet show typical symptoms of ulcerative colitis. Histological slices made from their intestine can be imaged with the microscope in brightfield illumination. Haematoxylin and eosin (H&E) staining colors the nuclei blue and the cytoplasm red and can be used to morphologically inspect the mouse colon (Figure 7).
Compared to the control group, DSS-treated mice show drastic lesions in the mucosa and an alteration of the overall epithelial structure. Moreover, these mice lost characteristic invaginations of the mucosa, the so-called crypts; and typically their mucosa and submucosa are infiltrated by inflammatory cells. On top of the cell-culture-based systems described before, this mouse model reveals results concerning chronic inflammation on the organismic level.
Discussion
Numerous diseases including neuroinflammatory disorders such as Parkinson’s disease or stroke, as well as systemic disorders, for example, (auto)immune disorders or cancer, are associated with chronic inflammation. Understanding the molecular processes of chronic inflammation will open new doors to cope with the associated diseases and develop strategies for their treatment.
Besides molecular biology, widefield microscopy is one major tool to get insights into the TLR radical cycle—the basis for chronic inflammation. For example, applying relatively simple, immunofluorescence microscopy at conventional resolution uncovers the translocation of NF-κB from the cytosol to the nucleus upon stimulation with LPS. In its role as a transcription factor, NF-κB enhances the expression of pro-inflammatory cytokines driving the TLR radical cycle.
Interestingly, not only LPS is capable of starting the inflammation process by TLR4 signaling activation; there are also other sources that can indirectly trigger TLR4 signaling. These can be, for example, nanoparticles, transition metals, semivolatile organic compounds, or ozone, which cause free radicals or directly provoke the production of DAMPs. As mentioned already, DAMPs in turn can activate the TLR4 pathway. Naturally, it is of interest to investigate this process further and decipher the mechanisms behind it.
Besides exploring the basic processes of this vicious circle, it is plausible that there are ways to disrupt it. Having on hand a cell-culture model for the observation of NF-κB translocation—as an indicator of inflammation—one can examine how to stop this progression. Numerous substances from herbal extracts are currently studied by our group for their potential to interfere with translocation of the transcription factor into the nucleus.
In addition to widefield-fluorescence techniques at conventional resolution, using methods of super resolution microscopy [12,13] might give more details about the mechanisms of inflammation even at single-molecule resolution.
Besides the protein status, the ion composition of a cell can provide information on inflammation processes. Typically, ion channels react on inflammation because their expression and function can be influenced by cytokines. Moreover, Ca2+ is involved, for example, in the maturation of interleukins via the inflammasome [14]. Hence, it can be used as an indicator of the inflammation progression. Ratiometric FURA imaging is a powerful tool when it comes to Ca2+ measurement [8]. The establishment of a reliable working system is the basis for further efforts deciphering more details of the TLR radical cycle and how to disrupt it. In the future one can imagine screening for substances that will have an effect on chronic inflammation indicated by an altered Ca2+ response.
At this point, it should be mentioned that ratiometric imaging needs a fast change of excitation wavelength or the detected wavelength, a strong light source, excellent transmission of optical components, and fast signal detection. The development of ultrafast filter wheels, UV-light optimized objectives, highly sensitive fluorophores, and fast and sensitive cameras (sCMOS) allow quantitative high-speed live-cell imaging in high spatial resolution.
In addition to in vitro studies, inflammation processes can also be studied in a whole organism. Thus, mice suffering from a chronic inflammation in the colon (ulcerative colitis) are interesting research subjects. In this case, their histologic status can be used as an indicator of the inflammation grade of the corresponding tissue. At this stage, chronic inflammation can be studied in a complete organism and how, for example, special diets affect ulcerative colitis, be it negatively or positively. In the future, usage of dyes changing their fluorescent behavior due to their oxidation status will be used as ROS indicators to get further insights.
Conclusion
Many different light microscopy techniques can be used to examine chronic inflammation at many positions of the underlying inflammatory feedback loop. Contrast methods range from brightfield to fluorescence microscopy with the option for ratiometric imaging. Examined samples can be of the size of a single cell or of a whole organ. Fixed cells and histological sections can be observed as well as living cells. Interestingly, for the approaches described in this report, researchers do not need more than one microscope for all the different techniques. Due to the flexibility and upgradability of a modern life science research microscope such as the Leica DMi8, plus user-friendly imaging software, cellular processes can be highlighted from many directions. With these benefits, light microscopy maintains its position in life sciences and will continue to decipher cell biological phenomena and help to fight diseases such as chronic inflammation.
Acknowledgements
Prof. Dr. Dr. Detlef Schuppan kindly made his facility available to us for the animal experiments. We are greatly indebted to Dr. Frank Helleis, Dr. Thomas Klimach, and the workshop of the Max Planck Institute for Chemistry for producing the self-made sample holder. Prof. Dr. Ulrich Pöschl and the Max Planck Society are gratefully acknowledged for support.
References
- K Lucas and M Maes, Mol Neurobiol 48 (2013) 190–204.
- K Lucas et al., CNS Neurol Disord Drug Targets 14(7) (2015) 838–54.
- LF Chen et al., Science 293 (2001) 1653–57.
- L Verstrepen et al., Cell Mol Life Sci 65 (2008) 2964–78.
- JJ Herskovic et al., Lung 180(4) (2002) 215–20.
- K Kandasamy et al., PLoS ONE 8(5) (2013) e63465.
- IA Hobai et al., J Surg Res 193(2) (2015) 888–901.
- A Takahashi et al., Physiological Rev 79 (1999) 1089–1125.
- X He et al., Sci Rep 6 (2016) article 28370.
- Y Fan and B Liu, Exp Ther Med 9(4) (2015) 1455–59.
- S Kitajima et al., Exp Anim 49 (2000) 9–15.
- C Cremer and BR Masters, Eur Phys J H 38(3) (2013) 281–344.
- C Cremer and U Birk: Front Phys 4(11) (2016).
- R van der Burgh and M Boes, Trends Endocrin Met 26(5) (2015) 263–71.
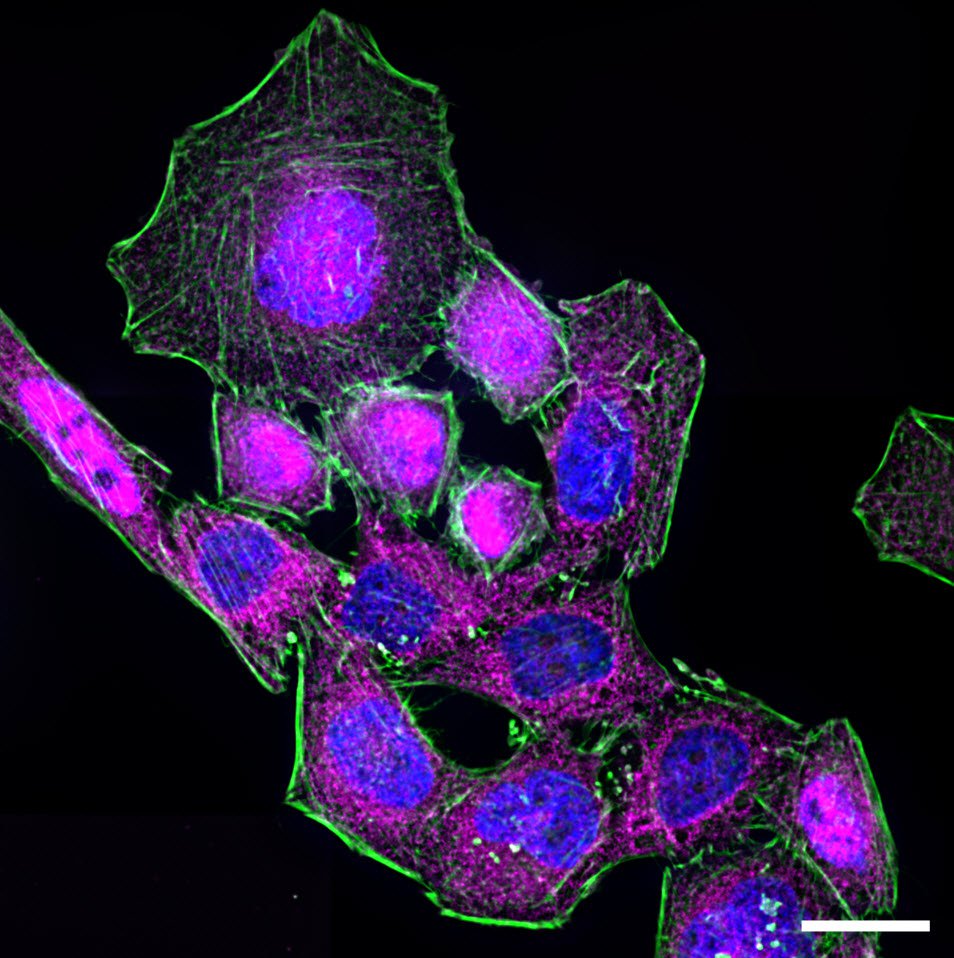
, tubulin with Cy5 (red), and nuclei with DAPI (blue). Image courtesy of Dr. Günter Giese, Max Planck Institute for Medical Research, Heidelberg, Germany.")
.")
 at Leica Microsystems.")
