Science Lab
Science Lab
Das Wissensportal von Leica Microsystems bietet Ihnen Wissens- und Lehrmaterial zu den Themen der Mikroskopie. Die Inhalte sind so konzipiert, dass sie Einsteiger, erfahrene Praktiker und Wissenschaftler gleichermaßen bei ihrem alltäglichen Vorgehen und Experimenten unterstützen. Entdecken Sie interaktive Tutorials und Anwendungsberichte, erfahren Sie mehr über die Grundlagen der Mikroskopie und High-End-Technologien - werden Sie Teil der Science Lab Community und teilen Sie Ihr Wissen!
Loading...

AI Confluency Analysis for Enhanced Precision in 2D Cell Culture
This article explains how efficient, precise confluency assessment of 2D cell culture can be done with artificial intelligence (AI). Assessing confluency, the percentage of surface area covered,…
Loading...

Precision and Efficiency with AI-Enhanced Cell Counting
This article describes the use of artificial intelligence (AI) for precise and efficient cell counting. Accurate cell counting is important for research with 2D cell cultures, e.g., cellular dynamics,…
Loading...

Leveraging AI for Efficient Analysis of Cell Transfection
This article explores the pivotal role of artificial intelligence (AI) in optimizing transfection efficiency measurements within the context of 2D cell culture studies. Precise and reliable…
Loading...

Empowering Spatial Biology with Open Multiplexing and Cell DIVE
Spatial biology and multiplexed imaging workflows have become important in immuno-oncology research. Many researchers struggle with study efficiency, even with effective tools and protocols. Here, we…
Loading...

6-Inch Wafer Inspection Microscope for Reliably Observing Small Height Differences
A 6-inch wafer inspection microscope with automated and reproducible DIC (differential interference contrast) imaging, no matter the skill level of users, is described in this article. Manufacturing…
Loading...

Visualizing Photoresist Residue and Organic Contamination on Wafers
As the scale of integrated circuits (ICs) on semiconductors passes below 10 nm, efficient detection of organic contamination, like photoresist residue, and defects during wafer inspection is becoming…
Loading...

Augmented Reality: Transforming Neurosurgical Procedures
In this ebook, you will explore the exciting advances that Augmented Reality (AR) brings to the field of neurosurgery. This comprehensive guide, including explanatory videos, addresses key questions…
Loading...

Laser Microdissection Protocols for Tissue and Cell Isolation - Download free eBook
In this Bio-protocol Selections, we present a collection of open-access, detailed methods papers using LCM to purify and isolate tissues and cells from plants, mouse embryos, cancer cells, neurons,…
Loading...

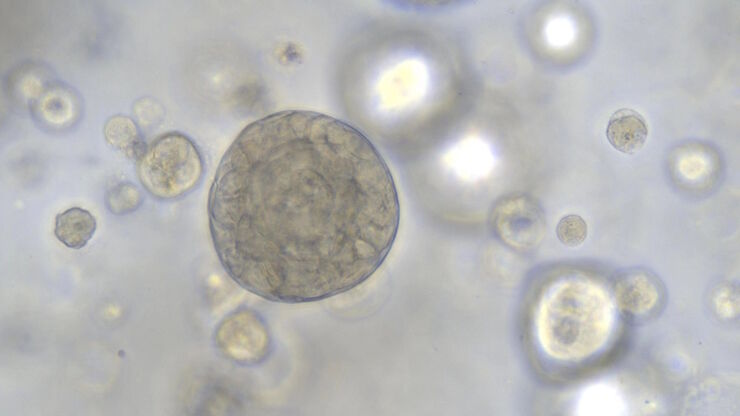
Overcoming Observational Challenges in Organoid 3D Cell Culture
Learn how to overcome challenges in observing organoid growth. Read this article and discover new solutions for real-time monitoring which do not disturb the 3D structure of the organoids over time.